What Is Stock Volatility? A Guide for Investors
If a stock moves past your strike, the option can be assigned — meaning you'll have to sell (in a call) or buy (in a put). Knowing the assignment probability ahead of time is key to managing risk.
Posted by
Related reading
A Step-by-Step Covered Calls Example for Consistent Income
Unlock consistent income with our step-by-step covered calls example. This guide breaks down the strategy, risks, and outcomes to help you trade confidently.
Long Call and Short Put The Ultimate Synthetic Stock Guide
Unlock the power of the long call and short put strategy. This guide explains how synthetic long stock works, its benefits, risks, and how to execute it.
What is a Call Spread? A Clear Guide to Bull and Bear Spreads
What is a call spread? Discover how bull and bear spreads limit risk and sharpen your options trading strategy.
At its core, stock volatility is the rate at which the price of a stock increases or decreases over a given period. It's the market's heartbeat—sometimes it's calm and steady, other times it's rapid and erratic.
High volatility means bigger price swings. This signals greater risk, but it also creates the potential for higher rewards.
Decoding Stock Market Volatility
Think of volatility like the weather.
A low-volatility stock is like a calm, sunny day with minor temperature changes. Its price moves are more predictable and tend to stay within a narrow range, offering stability. This is pretty common for large, established companies in steady industries, like utilities or consumer staples.
On the other hand, a high-volatility stock is like a stormy day with sudden, dramatic shifts. Its price can swing wildly, making it riskier but also presenting opportunities for significant gains. You’ll often see this kind of price behavior in tech startups or biotech firms waiting on big news, like clinical trial results.
Getting a handle on this fundamental concept is the first real step toward making more informed investment decisions.
This visual perfectly illustrates the fluctuating nature of stock prices, which is the very essence of volatility.
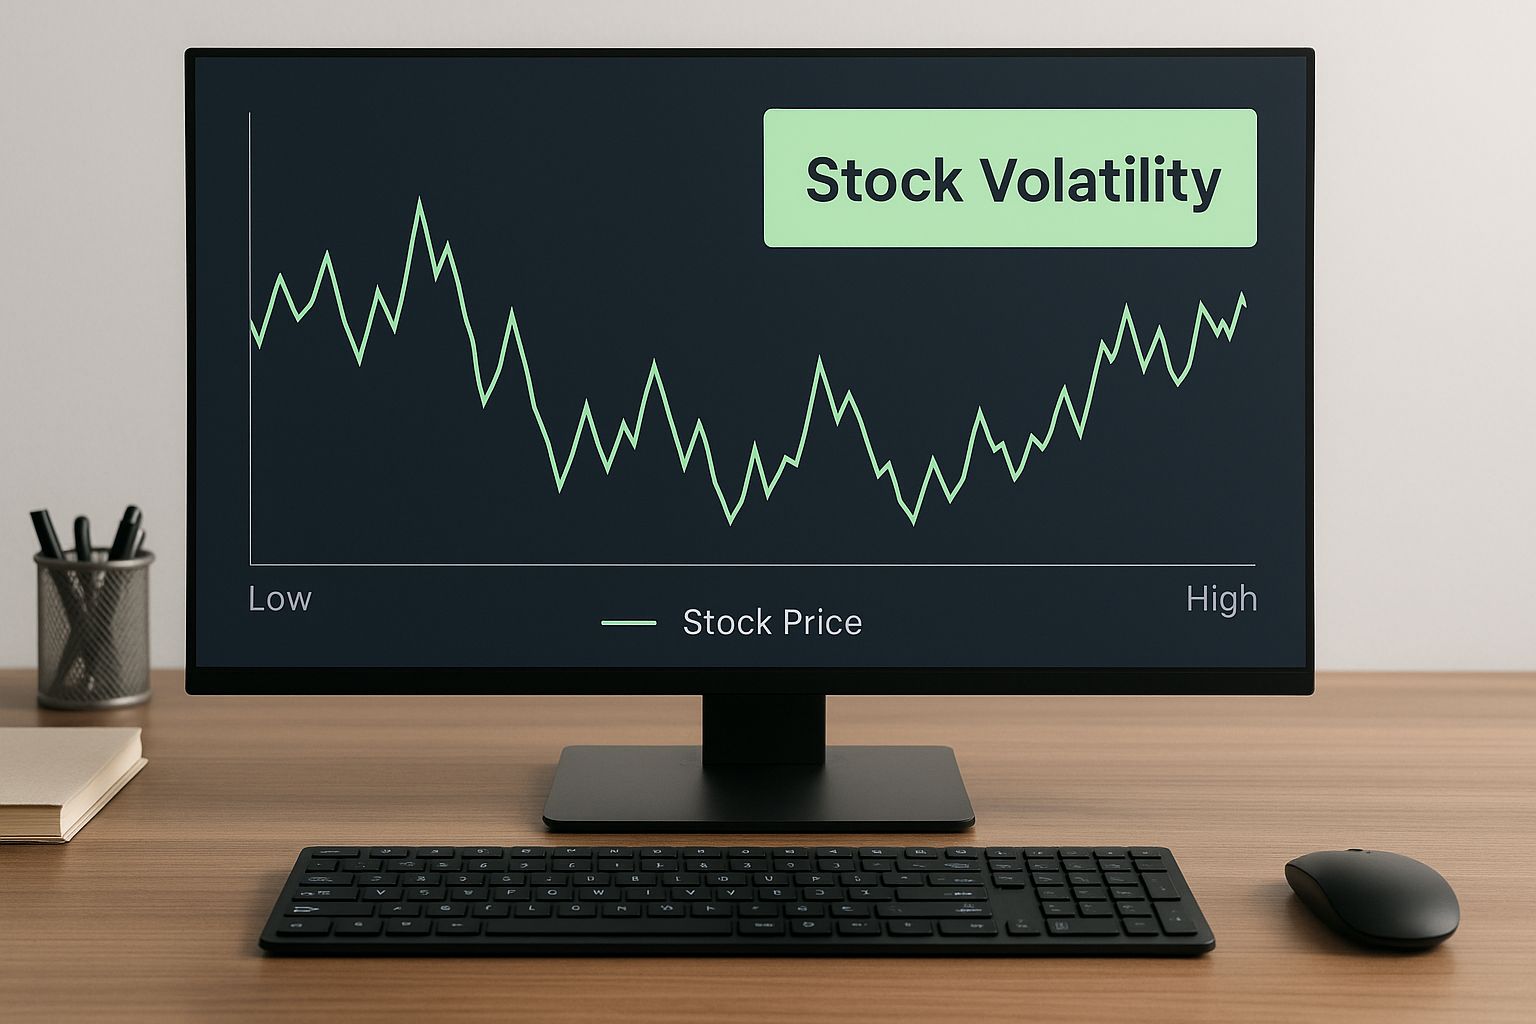
The graph's sharp peaks and deep troughs show periods of high volatility, while the flatter sections represent times of relative calm and stability.
To help you get a quick sense of the differences, here’s a simple breakdown.
Volatility At a Glance
| Characteristic | Low Volatility | High Volatility |
|---|---|---|
| Price Movement | Small, gradual changes | Large, rapid swings |
| Risk Level | Lower | Higher |
| Potential Return | Lower | Higher |
| Investor Feeling | Sense of stability, predictability | Uncertainty, opportunity |
| Example Stocks | Utility companies, consumer goods | Tech startups, biotech firms |
This table just scratches the surface, but it gives you a solid starting point for understanding how these two environments feel and function.
Key Characteristics of Volatility
Volatility isn't just random noise; it's a measurable indicator of risk and what the market is feeling. Investors track it to gauge the level of uncertainty or fear. A sudden spike often follows major economic news, geopolitical events, or a big company announcement.
To really grasp what stock volatility is, keep these core ideas in mind:
- It Measures Risk: This one’s direct. Higher volatility translates to higher risk, as the potential for an asset to lose value quickly goes up.
- It Creates Opportunity: At the same time, those big price swings can create chances to profit for traders who can correctly anticipate where the market is headed.
- It Is Not Directional: This is a crucial point. Volatility only measures the magnitude of price changes, not whether they’re going up or down. A stock can be highly volatile while trending upwards, downwards, or even just sideways.
Ultimately, volatility is a double-edged sword. While it introduces uncertainty, it is also the very force that allows investors to profit from price movements. Without it, the potential for market gains would be severely limited.
Using Historical Volatility to Assess Past Risk
To figure out where a stock might go next, it often helps to first look at where it’s been. Think of Historical Volatility (HV) as a ship's logbook—it tells you exactly how rough or calm the seas were on its journey so far.
It’s a backward-looking metric, calculated from a stock’s actual price swings over a set period. A higher HV means the price has been all over the place, suggesting a riskier ride. A lower number points to a history of stability.
For example, a big utility company will almost always have low historical volatility. Its services are essential, so its revenue is consistent—no big surprises. On the other hand, a small biotech firm’s history might look like a seismograph during an earthquake, with its price jumping or crashing on news about clinical trials or FDA approvals.
Calculating and Interpreting the Data
Analysts usually look at HV over different timeframes—like 30, 60, or 90 days—to get a feel for both short-term jitters and long-term temperament. A stock might look calm on a yearly chart, but its 30-day volatility could be spiking, signaling a new risk is brewing under the surface.
This data gives you a crucial baseline for risk. While it can’t predict the future, it does reveal a stock’s personality. Knowing how a stock has behaved in the past helps you set realistic expectations for what it might do next. This is a core part of building many trading models, which you can explore further by learning how to backtest a trading strategy with historical data.
You can see historical volatility in action during major market events. During the Wall Street Crash of 1929, the Dow Jones Industrial Average plunged roughly 24% in just two days. In the weeks that followed, realized volatility—a direct measure of these past price swings—shot up to an incredible 127%, reflecting the pure panic that kicked off the Great Depression. You can see a great timeline of the biggest volatility cycles on ig.com.
Practical Applications of Historical Volatility
So, what do you actually do with this information? Traders put HV to work in a few key ways.
- Setting Risk Parameters: If you know a stock’s typical price swing, you can set smarter stop-loss orders to protect yourself from unusually sharp drops.
- Identifying Opportunities: When a typically jumpy stock suddenly goes quiet and its historical volatility drops, it might be coiling up for a big move. This could signal a breakout opportunity.
- Comparing Assets: HV gives you a straight, data-driven way to compare the risk level between two different stocks, or even entire market sectors.
Remember, historical volatility is a rearview mirror. It’s great for understanding the road you've already traveled, but it can't show you the sharp turns or roadblocks just ahead.
How Implied Volatility Forecasts Future Moves
While historical volatility is all about looking in the rearview mirror, implied volatility (IV) is the market’s weather forecast. It’s a powerful, forward-looking metric that tells us what investors expect future price swings to look like.
Instead of being calculated from past performance, IV is pulled directly from the current prices of stock options.
Think of it like this: when traders know a big event is coming—an earnings report, an FDA announcement, you name it—they rush to buy options. They might be hedging their bets or speculating on a massive price swing.
This flood of demand drives up option prices. And since volatility is a key ingredient in how options are priced, higher prices directly translate to higher implied volatility. It’s a direct measure of market sentiment, not a guarantee, but the closest thing we have to a crystal ball.
The VIX: Taking the Market’s Temperature
So, how do we gauge the mood of the entire market? For that, investors turn to the CBOE Volatility Index, better known as the VIX.
Often called the "fear index," the VIX measures the market's 30-day expectation of volatility for the S&P 500. A rising VIX points to growing anxiety and potential turbulence ahead. A low or falling VIX, on the other hand, signals that investors are feeling calm and confident.
Implied volatility captures the market's collective gut feeling. When option prices are high, it’s a clear signal that traders are bracing for impact, expecting bigger price swings in the near future.
Historically, the VIX tends to hang out around an average of 20. When it starts climbing above 30, you know fear and uncertainty are creeping in. The index has a habit of going wild during major crises, spiking to nearly 80 during the 2008 financial meltdown and soaring even higher in March 2020 as the COVID-19 pandemic shook the world.
Putting Implied Volatility to Work
For anyone trading options, understanding implied volatility isn't just helpful—it's non-negotiable. IV has a direct and immediate impact on the price you pay or receive for an option.
Here’s how it typically plays out:
- When IV is High: Option premiums get expensive. This is great for option sellers (think covered calls or secured puts), who can collect more income for the risk they’re taking on.
- When IV is Low: Option premiums are cheap. This can be a perfect time for option buyers who think a stock is about to make a big move that the market hasn't priced in yet.
Getting a handle on how these expectations shape option prices is fundamental. If you want to go deeper into the mechanics, check out our guide on how to calculate implied volatility to see exactly how it affects every trade you make.
The Real-World Triggers of Market Volatility
Stocks don't move in a vacuum. Their prices swing because they’re constantly reacting to new information pouring in from every corner of the globe. To really get a handle on volatility, you have to understand the real-world events that cause these moves.
Some triggers are huge, shaking the entire market. Others are hyper-specific, hitting just one company. Think of the market as a massive, interconnected web—when one thread gets pulled, the vibrations travel everywhere.
That’s why a surprise announcement from a central bank or a major political shift can unleash widespread uncertainty. Investors scramble to reassess their risk all at once, and that collective reaction is what drives those sharp, sudden price movements.
Key Drivers of Price Swings
While a million different things can nudge a stock's price, the big movers usually fall into a few key categories. Each one introduces fresh information that forces the market to re-price an asset's value, creating the very swings we call volatility.
These catalysts can be anything from global economic forces to a single piece of company news.
- Economic Announcements: Big reports on inflation (CPI), employment numbers, and interest rate decisions are massive drivers. If inflation comes in hotter than expected, it sparks fears of aggressive rate hikes from the central bank, which almost always puts a chill on stock prices.
- Geopolitical Events: Elections, trade wars, and global conflicts inject a huge dose of uncertainty into the system. The outcome of a presidential election, for example, can rewrite the rules for entire industries, causing volatility to spike as traders try to get ahead of the changes.
- Company-Specific News: This is volatility on a micro-level. A company crushing its earnings report can send its stock flying. On the flip side, news of a product recall, a data breach, or a CEO suddenly resigning can cause it to crater.
The market is a forward-looking machine, constantly trying to price in what’s going to happen next. Volatility is just the physical result of that process—it’s the collective indecision and recalculation that happens when new, unexpected information hits the scene.
The Role of Market Sentiment
Beyond the hard data and news events, there's another powerful, invisible force at play: market sentiment. This is the collective mood of investors—are they feeling fearful (bearish) or greedy (bullish)?
This collective psychology can become a self-fulfilling prophecy. Widespread fear can trigger a massive sell-off that drives prices down, regardless of how solid a company's fundamentals are.
These swings are measurable. In the U.S., stock price volatility was reported at roughly 24.99 in 2021, which is just a number that captures how much prices were bouncing around on average. To see how that metric has changed over the years, you can explore the historical market uncertainty data on fred.stlouisfed.org.
At the end of the day, volatility is what happens when the market tries to process a nonstop flood of news, data, and raw human emotion.
How to Navigate Volatility in Your Portfolio

Knowing what volatility is and where it comes from is one thing. Actually managing it is a completely different ballgame. Instead of running from choppy markets, smart investors lean on proven strategies to protect their money and even spot opportunities.
The goal isn't to get rid of risk—that's impossible. It's to manage it with a clear head.
By building a portfolio that can handle the bumps, you can navigate turbulent times with a plan instead of making emotional decisions when the market drops. It's this proactive mindset that turns volatility from a threat into just another part of the journey.
Building a More Resilient Strategy
The absolute foundation of managing market swings is diversification. Don't put all your eggs in one basket. By spreading your investments across different asset classes (like stocks and bonds), sectors (tech, healthcare, etc.), and even geographies, you soften the blow if one area takes a big hit.
Another incredibly useful tool is the stop-loss order. This is basically a pre-set instruction you give your broker to sell a stock if it drops to a certain price. Think of it as an automatic safety net that prevents a small loss from snowballing into a huge one during a sudden downturn.
Volatility creates both risk and opportunity. A well-prepared investor focuses on a repeatable process, using proven tools and a long-term perspective to weather the inevitable storms and capitalize on market dislocations.
Finally, you have to stay on top of portfolio rebalancing. Over time, your winning investments will naturally grow and take up a bigger slice of your portfolio, which quietly concentrates your risk. Rebalancing means you periodically sell a bit of the winners and buy more of your underperformers to get back to your original target allocation.
Actionable Steps for Your Portfolio
So, how do you put this into practice? It comes down to a few key habits that can make a massive difference in how your portfolio weathers a storm.
- Diversify Broadly: Don't just own a bunch of different stocks. Own different types of investments. When stocks get wild, assets like bonds or commodities can often provide some much-needed stability.
- Set Clear Stop-Loss Orders: Figure out how much you're willing to lose on a position before you even buy it, then set your stop-loss order right away. This takes the emotion right out of the selling decision.
- Rebalance on a Schedule: Pick a regular time—maybe every quarter or once a year—to review your portfolio and make adjustments. This disciplined approach forces you to consistently buy low and sell high.
These techniques are core to a solid financial plan. To go deeper, you can explore the best practices for risk management in our detailed guide.
Common Questions About Stock Volatility
Diving into the world of stock volatility can stir up a lot of questions, especially when you start connecting the textbook theories to what’s actually happening in the market. Let's tackle some of the most common points of confusion to help you build real confidence in your trading strategy.
A big one I hear a lot is whether volatility is "good" or "bad." The honest answer? It completely depends on your game plan. For a long-term, set-it-and-forget-it investor, high volatility can feel like a lot of stressful, unnecessary noise. But for an options trader, it's the very thing that creates opportunity, pumping up the premiums you can collect.
Is Volatility the Same as Risk?
This is a critical distinction. While they’re definitely related, volatility and risk are not the same thing. Volatility is simply a measure of how much a stock's price bounces around, whereas risk is the potential for you to permanently lose your money. A highly volatile stock isn't guaranteed to lose you money; its price just takes wilder swings.
That said, high volatility often dials up the risk. The wider the price swings, the greater the chance of a massive, unrecoverable drop. I like to think of it this way:
- Volatility is the turbulence you feel on a flight. It’s bumpy and uncomfortable.
- Risk is the chance the plane won't land safely.
A little turbulence doesn't mean the flight is doomed. In the same way, understanding a stock's volatility helps you brace for the bumps without panicking.
Can a Stock Have High Volatility but Go Nowhere?
Absolutely, and it happens all the time. A stock can have massive daily swings—jumping 5% one day and dropping 4% the next—only to end the year right back where it started. This is a perfect example of why we say volatility is non-directional.
Volatility only measures the magnitude of the price moves, not the overall trend or direction. This is a key insight for traders who aim to profit from the swings themselves, rather than just waiting for long-term growth.
The key takeaway is that volatility measures the size of the market's mood swings, not whether that mood is ultimately positive or negative. A stock can be emotionally erratic without making any real progress.
How Do Major Events Affect Volatility?
Big, scheduled events like presidential elections tend to create a pretty predictable pattern in market volatility. In the days leading up to an election, uncertainty is through the roof. Nobody knows the outcome, and that anxiety typically drives up implied volatility (which you can see in the VIX).
But as soon as the results are in, that specific uncertainty vanishes, and volatility almost always plummets. In fact, data shows that for seven of the last ten U.S. presidential elections, the VIX dropped the day after the election was called. It’s a classic example of how markets price in uncertainty and then breathe a sigh of relief once a clear outcome is known.
Ready to turn volatility into opportunity? Strike Price provides real-time probability data to help you sell covered calls and secured puts with confidence. Make smarter, data-driven decisions and stop guessing. Explore your options with Strike Price today.