How to Calculate Implied Volatility for Options Trading
If a stock moves past your strike, the option can be assigned — meaning you'll have to sell (in a call) or buy (in a put). Knowing the assignment probability ahead of time is key to managing risk.
Posted by
Related reading
A Step-by-Step Covered Calls Example for Consistent Income
Unlock consistent income with our step-by-step covered calls example. This guide breaks down the strategy, risks, and outcomes to help you trade confidently.
Long Call and Short Put The Ultimate Synthetic Stock Guide
Unlock the power of the long call and short put strategy. This guide explains how synthetic long stock works, its benefits, risks, and how to execute it.
What is a Call Spread? A Clear Guide to Bull and Bear Spreads
What is a call spread? Discover how bull and bear spreads limit risk and sharpen your options trading strategy.
Calculating implied volatility means using an options pricing model, like the famous Black-Scholes model, to solve for one specific input: volatility. It’s essentially working backward from an option's current market price to figure out what the market thinks future price movement will be.
What Implied Volatility Reveals About The Market

Let's cut through the jargon. Think of implied volatility (IV) not as a hard historical fact, but as the market's collective gut feeling about a stock's future. It's the "missing variable" that makes a theoretical options model match what traders are actually paying for an option in the real world.
At its core, IV is a powerful sentiment gauge. High IV often signals fear or uncertainty, as traders are betting on bigger price swings. On the flip side, low IV suggests complacency—a belief that prices will stay relatively calm. Getting a feel for this dynamic is a game-changer for any options trader.
A Forward-Looking Metric
This is what makes IV so different from historical volatility, which just looks in the rearview mirror at past performance. IV is all about what’s next. It’s a real-time snapshot of what people are willing to pay for options, which tells you everything about their perception of upcoming risk.
One of the cornerstones for calculating this is the Black–Scholes model, which has been a staple since its development back in 1973. IV is the magic number that you plug into the Black-Scholes formula to make its theoretical price equal the actual market price.
Decoding Market Expectations
To really get what IV is telling you, it helps to see how it connects to other indicators like the VIX, often called Wall Street's 'fear gauge'. Both are pulled from options prices and give you clues about the collective psychology of traders.
You don’t need a Ph.D. in math to use IV, but understanding where it comes from is the first step toward making smarter trades. It allows you to:
- Spot potentially overpriced or underpriced options.
- Get a better read on the risk-reward profile of a trade.
- Manage your overall portfolio risk more effectively.
By learning to calculate implied volatility, you're not just crunching numbers; you're learning to read the market's mood. This skill can help you shift from being a reactive trader to a proactive, strategic one.
Gathering Your Key Calculation Inputs
Before you can pull implied volatility out of thin air, you need the right ingredients. Think of it like a recipe—miss a single component, and the whole thing falls flat. The formula we lean on for this, the Black-Scholes model, needs five specific data points to work its magic.
First up is the Option’s Market Price. This is your starting point, the actual premium you’d pay or receive to trade the contract right now. It's the "answer" we're trying to work backward to justify.
Next, you need the Underlying Stock Price. Simple enough—this is what the stock is trading for on the open market at this very moment. It's the anchor for the option's value.
Defining Your Contract Terms
The next couple of inputs are tied directly to the specific options contract you're looking at.
The Strike Price is the price you've agreed you can buy or sell the underlying stock at. Choosing the right one is a huge part of your strategy, and our guide on how to choose an option strike price can walk you through that decision-making process.
You also need the Time to Expiration. This isn't just a simple count of the days left. It has to be converted into a fraction of a year. An option with 90 days left on the clock has a time to expiration of roughly 0.25 (90 divided by 365). This variable has a massive impact, since more time usually means more opportunity for the stock to move.
Remember, the whole point is to find the one volatility number that, when you plug it into the model with these other four inputs, spits out the option's current market price.
Finally, we need the Risk-Free Interest Rate. This represents the theoretical return you'd get from an investment with zero risk. Traders typically just grab the yield on a short-term U.S. Treasury bill that matures around the same time as the option. While its impact is often smaller than the other inputs, it's still a necessary piece for an accurate calculation.
To make this crystal clear, here’s a quick summary of the five variables you need to gather before running any calculations.
Essential Inputs for the Black-Scholes Model
This table breaks down each required input and where you can typically find it.
| Input Variable | Description | Common Source |
|---|---|---|
| Option's Market Price | The current premium (cost) of the option contract. | Your brokerage platform's options chain. |
| Underlying Stock Price | The real-time market price of the individual stock. | Any financial news site or your trading app. |
| Strike Price | The agreed-upon price to buy or sell the stock. | Listed directly on the options contract. |
| Time to Expiration | The lifespan of the option, expressed in years. | Calculate from the expiration date (Days left / 365). |
| Risk-Free Interest Rate | The theoretical rate of return of a zero-risk investment. | U.S. Treasury website (look for T-Bill rates). |
Once you have these five pieces of information in hand, you've got everything you need to start uncovering what the market is truly expecting from the stock's future.
The "Guess and Check" Logic Behind the Calculation
Here’s the thing about calculating implied volatility: there's no simple, direct formula like A + B = C. You can’t just plug in the numbers and get an instant answer. Instead, the real work happens through a clever, iterative process that’s best described as a high-speed game of "guess and check."
This method is the engine under the hood of every implied volatility calculator, from sophisticated trading platforms to the functions you might use in a spreadsheet. It’s all about working backward to find the one missing piece of the puzzle.
It all starts with a reasonable guess for volatility. Let’s say an algorithm starts with an initial guess of 25% for an option contract. It plugs this number, along with the other five inputs (stock price, strike price, time, etc.), into an options pricing model like Black-Scholes. This spits out a theoretical option price.
The computer then immediately compares its calculated price to the option's actual market price. Is the theoretical price higher or lower?
Zeroing In on the Right Number
If the model’s price comes out too low, it means the first volatility guess wasn't high enough. So, the algorithm makes a smarter, slightly higher guess—maybe 28%—and runs the entire calculation again. If that new price is now too high, it knows the true IV must be somewhere between 25% and 28%.
This back-and-forth loop of guessing, calculating, and comparing happens thousands of times in the blink of an eye. Each cycle refines the guess, systematically narrowing the gap until the model’s theoretical price perfectly matches the real-world market price.
This visual flow shows exactly how those inputs are used in this iterative loop to land on the final implied volatility figure.
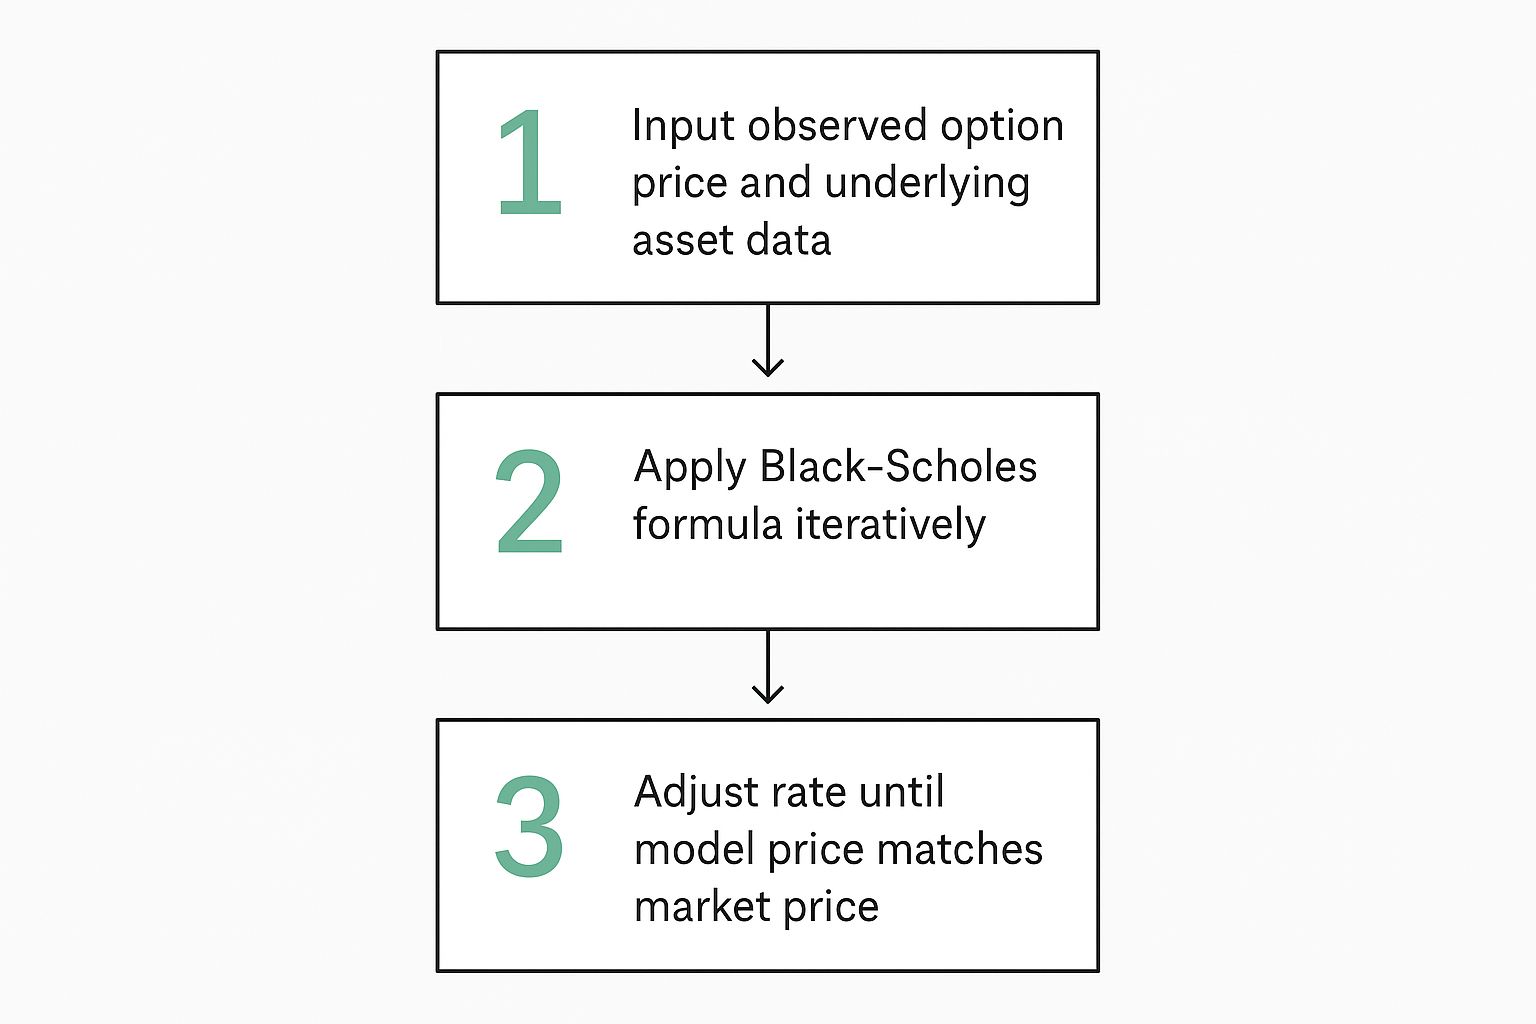
As you can see, the process isn't about solving one big equation. It's about repeating a cycle until the output matches a known target—the option's current market price. The specific volatility figure that makes this match is, by definition, the implied volatility.
This is exactly why understanding the inputs is so critical. A small change in the time to expiration or the risk-free rate will alter the target the algorithm is aiming for, which will naturally result in a different final IV.
The "guess and check" method is formally known as a root-finding algorithm, like the Newton-Raphson method. Its purpose is to find the input (volatility) that makes the difference between the model price and the market price equal to zero.
Practical Implications for Traders
So, why does any of this matter to you as a trader? Honestly, understanding this logic helps you trust the IV numbers you see on your platform. It’s not just some random number; it's the result of a precise computational process designed to perfectly reflect what the market is doing right now.
This logic also explains a few key things:
- Speed: Modern computers fly through these iterations almost instantly, giving you the real-time IV data you need to make decisions.
- Dependency: The final IV is completely dependent on the accuracy of the other inputs, especially the option's live market price.
- Probability: This calculated IV becomes a critical component in forecasting future price movements. You can see how this all connects to real-world trading outcomes with a good options probability calculator.
Ultimately, when you look at an IV figure of 35%, you can be confident that it’s the one unique number that makes all the math work for that specific option, at that exact moment in time.
Putting the Formula to Work with a Real Stock

Theory is great, but let's make this real. We can see how the "guess and check" logic plays out by walking through an example with a stock everyone knows. This will show you exactly how an implied volatility calculator chews through market data to spit out an answer.
Let's use Apple Inc. (AAPL) for our case study. Say we're eyeing a call option and want to find its implied volatility to see what the market is thinking.
First things first, we need to pick a specific contract and pull our five key inputs from the market.
Setting Up the AAPL Example
We'll look at a slightly out-of-the-money call option, which is perfect for seeing how the market prices potential moves to the upside. Here are the real-time data points we'll use for our calculation:
- Underlying Stock Price (S): AAPL is trading right at $190.00.
- Strike Price (X): We’ve chosen the $195.00 call option.
- Time to Expiration (t): The option expires in 30 days, so we calculate t as 30/365 ≈ 0.0822 years.
- Risk-Free Interest Rate (r): A comparable U.S. Treasury bill is yielding 5.0%, which we'll use as 0.05.
- Option's Market Price: The premium for this specific $195 call is $3.80.
Okay, we have all the puzzle pieces. The mission is to find the single volatility percentage that makes the Black-Scholes formula calculate a theoretical price of exactly $3.80.
This is where the iterative process kicks in. A calculator doesn't solve this in one go; it starts guessing. The goal is to get the model's output to match the known market price of the option.
The Calculation in Action
An automated calculator—or a spreadsheet function—takes over from here, running that high-speed "guess and check" loop. Here’s a play-by-play of what's happening under the hood:
Guess #1: The calculator starts with a reasonable guess for implied volatility, let's say 30% (0.30). It plugs this, along with our other four inputs, into the Black-Scholes formula.
- Result: The model pops out a theoretical option price of $3.25.
Comparison #1: The model's price ($3.25) is too low compared to the actual market price ($3.80). This tells the algorithm its volatility guess wasn't high enough. The market is clearly pricing in more potential action than 30%.
Guess #2: So, the algorithm adjusts its guess upward. It tries a new implied volatility of 35% (0.35) and runs the entire calculation again.
- Result: This time, the model calculates a price of $3.95.
Comparison #2: Now the model's price ($3.95) is higher than the market price ($3.80). The algorithm now knows the true implied volatility is somewhere between 30% and 35%.
This back-and-forth continues, with each guess getting closer and closer until the model's calculated price lands on the $3.80 market price. After a few more lightning-fast attempts, it finds the answer: 33.5%.
This final number is the implied volatility for our AAPL $195 call. It's the market's consensus that, over the next 30 days, AAPL will move with volatility equivalent to an annualized 33.5% standard deviation. To run these kinds of models and perform the iterative calculations needed for implied volatility, a solid handle on spreadsheet functions is a must. You can build up that skill by mastering Excel financial formulas, which are the backbone for tons of financial modeling.
Using Implied Volatility to Sharpen Your Trading Edge
Figuring out how to calculate implied volatility is a huge step, but the real power comes from using it to make smarter decisions. Knowing an option’s IV is like knowing a car's horsepower; it's a key spec, but pretty useless until you know how to apply it on the road. This is where you can gain a genuine advantage.
One of the most effective things you can do is compare an option's implied volatility (IV) to its historical volatility (HV). Just think of HV as the stock's "normal" behavior based on its past price swings. IV, on the other hand, is the market's "current mood"—its expectation for what's coming next.
When IV is way higher than HV, it's a signal that the market is pricing in more fear or excitement than usual. That anxiety inflates the option's premium, making it relatively "expensive." For anyone selling options, this can be a golden opportunity.
Spotting High and Low IV Opportunities
When implied volatility is jacked up, it directly boosts the premium you collect from selling options. This makes strategies like covered calls or cash-secured puts much more attractive because you get paid more for taking on the same amount of risk. Your potential return on investment gets a nice bump simply because market anxiety is high.
On the flip side, when IV is unusually low compared to its historical average, it suggests the market might be getting a little complacent. Option premiums will be relatively "cheap." For an option buyer, this could be the perfect time to grab some calls or puts, since you're paying less for the potential of a big price move.
By putting IV in context with HV, you move from just reading a number to interpreting a market signal. This comparison helps you judge whether you're getting a good deal on an option's premium or if you're potentially overpaying.
This context is absolutely essential for solid options risk management, as it helps you avoid buying into hype or selling into panic without a data-backed reason.
Calculate the Expected Stock Move
Another powerful way to use IV is to calculate the stock's expected price range by a certain date. It gives you a data-driven probability cone, helping you set realistic goalposts for where the stock might land.
Here’s a quick-and-dirty way to figure out the expected move for a single day:
- Divide the IV by the square root of 252. Why 252? That's roughly the number of trading days in a year. So for an IV of 32%, the math is 32 / 15.87 ≈ 2.02%.
- Multiply this percentage by the current stock price. If your stock is trading at $100, the expected one-day move is $2.02.
This tells you the market is currently pricing in a potential one-day move of about $2.02 up or down. You can do similar math for longer timeframes—like until your option's expiration—by just adjusting the number of days.
Now, this expected move isn't a guarantee. But it does frame the potential outcomes based on what the market is actually pricing in right now. You can use it to:
- Set more intelligent strike prices for your trades.
- Decide if a profit target is actually realistic.
- Manage your expectations and avoid nasty surprises.
Ultimately, once you start integrating these IV applications into your routine, you'll transform from a passive participant into an active strategist who can spot opportunities and manage risk with much greater confidence.
Common Questions About Implied Volatility

Even after you get the hang of calculating implied volatility, some practical questions always pop up. Let's tackle a few of the most common ones I hear from traders to help solidify your understanding.
Getting these concepts down is key to building a more intuitive feel for what IV really means in the market.
Can Implied Volatility Be Zero or Negative?
The short answer is no. Implied volatility can never be negative, and a value of zero is practically impossible for any stock you’d actually trade.
Think of it like standard deviation—it’s measuring the expected size of a price move. Because of that, its absolute lowest value is zero. A zero IV would mean the market is pricing in a 0% chance of the stock's price moving at all. That's just not realistic. You'll always see IV as a positive number.
What Is the Difference Between Implied and Historical Volatility?
This is a fantastic question, and the distinction is all about time.
Historical Volatility (HV) is purely backward-looking. It tells you how much a stock’s price actually moved over a specific past period, like the last 30 or 60 days. It's a fact; it already happened.
Implied Volatility (IV), on the other hand, is completely forward-looking. It’s baked into today's live option prices and reflects the market's collective guess about future volatility. Experienced traders constantly compare IV to HV to see if the current market "fear" is higher or lower than the stock's typical behavior.
Why Does IV Rise Before Earnings Reports?
This is a classic IV scenario. Implied volatility spikes right before big, scheduled events like earnings because of one thing: massive uncertainty.
The market knows a huge piece of information is about to drop, which could send the stock soaring or crashing. But nobody knows which way it will go.
This uncertainty drives a huge surge in demand for options from both speculators trying to hit a home run and investors trying to hedge their positions. That demand inflates option premiums, and since IV is derived directly from those prices, it shoots up. The dramatic drop in IV right after the news is out is what traders call "volatility crush."
Does Every Option on the Same Stock Have the Same IV?
Nope, and this is where things get really interesting for advanced strategies. Every option contract—with its own unique strike price and expiration date—will have its own distinct implied volatility.
This difference across the options chain creates what's known as the "volatility smile" or "volatility skew." Typically, you'll see out-of-the-money options carrying higher IVs than at-the-money options. This reflects the market's perception of risk and demand for different strike prices.
Ready to turn these insights into action? Strike Price empowers you with real-time probability data for every strike price, helping you make smarter, data-driven decisions on your covered call and secured put trades. Stop guessing and start strategizing at https://strikeprice.app.