What Is an Options Spread a Trader's Guide to Defined Risk
If a stock moves past your strike, the option can be assigned — meaning you'll have to sell (in a call) or buy (in a put). Knowing the assignment probability ahead of time is key to managing risk.
Posted by
Related reading
A Step-by-Step Covered Calls Example for Consistent Income
Unlock consistent income with our step-by-step covered calls example. This guide breaks down the strategy, risks, and outcomes to help you trade confidently.
Long Call and Short Put The Ultimate Synthetic Stock Guide
Unlock the power of the long call and short put strategy. This guide explains how synthetic long stock works, its benefits, risks, and how to execute it.
What is a Call Spread? A Clear Guide to Bull and Bear Spreads
What is a call spread? Discover how bull and bear spreads limit risk and sharpen your options trading strategy.
An options spread is a strategy where you buy one option and sell another on the same stock at the same time. Think of it as trading a team of options instead of just a single player. This approach lets you build a position with defined risk and a much more specific goal.
The Power of Building With Spreads
Imagine you're building something with LEGOs. A single option is like one big, oversized block—it’s powerful, sure, but it can also be clumsy. It might offer huge profit potential, but it can also come with massive, sometimes undefined, risk.
An options spread, on the other hand, is like picking out several different LEGO pieces to build exactly what you want. You get to control the shape, size, and stability of your creation right from the start.
That’s the core idea behind options spreads. Instead of just making a simple directional bet (like buying a call and hoping the stock rips higher), you’re constructing a strategic position by combining at least two different option contracts.
This multi-leg approach gives you a few major advantages over trading single options:
- Defined Risk: You know your absolute maximum loss the second you place the trade. No surprises.
- Reduced Cost: The option you sell helps pay for the option you buy, lowering your total cash outlay.
- Targeted Outcomes: You can design spreads to profit from very specific scenarios, like a stock simply staying within a certain price range.
- Capital Efficiency: Because the risk is capped, spreads often require less capital or margin from your broker.
Options Spreads vs Single Options at a Glance
To make the difference crystal clear, let's compare trading a single option against using a spread.
This table provides a quick comparison between trading a single option contract and using an options spread, highlighting key differences in structure, risk, and strategic purpose.
| Feature | Single Option (e.g., Long Call) | Options Spread (e.g., Bull Call Spread) |
|---|---|---|
| Structure | One contract (buy or sell). | Two or more contracts (simultaneously buying and selling). |
| Risk Profile | Often undefined or 100% of the premium paid. | Risk and reward are capped and known upfront. |
| Cost | Full premium paid for long options. | Net cost is reduced because selling an option finances buying another. |
| Strategic Purpose | Simple directional bets (up, down) or volatility plays. | Targeted outcomes (e.g., profit if a stock stays in a range or moves slowly). |
| Capital Required | Can be high for selling naked options or buying expensive ones. | Generally lower due to the defined-risk structure. |
As you can see, spreads trade the potential for unlimited gains for a structure with limited, defined risk and a higher probability of success in certain scenarios.
From Simple Bets to Strategic Structures
The move toward spread trading really took off with modern options markets after the Black–Scholes model was introduced in 1973. As the markets matured, traders naturally looked for ways to limit their risk, and spreads became the go-to solution.
Today, spreads make up a massive portion of all trading activity. With U.S. options markets regularly seeing tens of millions of contracts traded daily, they've become a practical tool for traders at every level. You can see the sheer scale of the modern options market in recent Cboe volume reports.
An options spread transforms trading from a simple "up or down" guess into a calculated strategy. It’s about defining your potential profit, capping your potential loss, and putting the probabilities in your favor.
By combining options, you can fine-tune your market view—whether you're bullish, bearish, or completely neutral. This strategic depth is exactly why so many traders eventually graduate from just buying calls and puts to building sophisticated spreads. It’s the difference between buying a lottery ticket and designing an investment with a clear, deliberate plan.
The Three Foundational Types of Options Spreads
Every options spread, no matter how complicated it seems, is built from one of three simple blueprints. Think of them like the primary colors of trading. Once you master the core structures—vertical, horizontal, and diagonal—you can combine them to create almost any strategy you can imagine.
At its core, an options spread is just a structured trade made by pairing a bought option with a sold option.
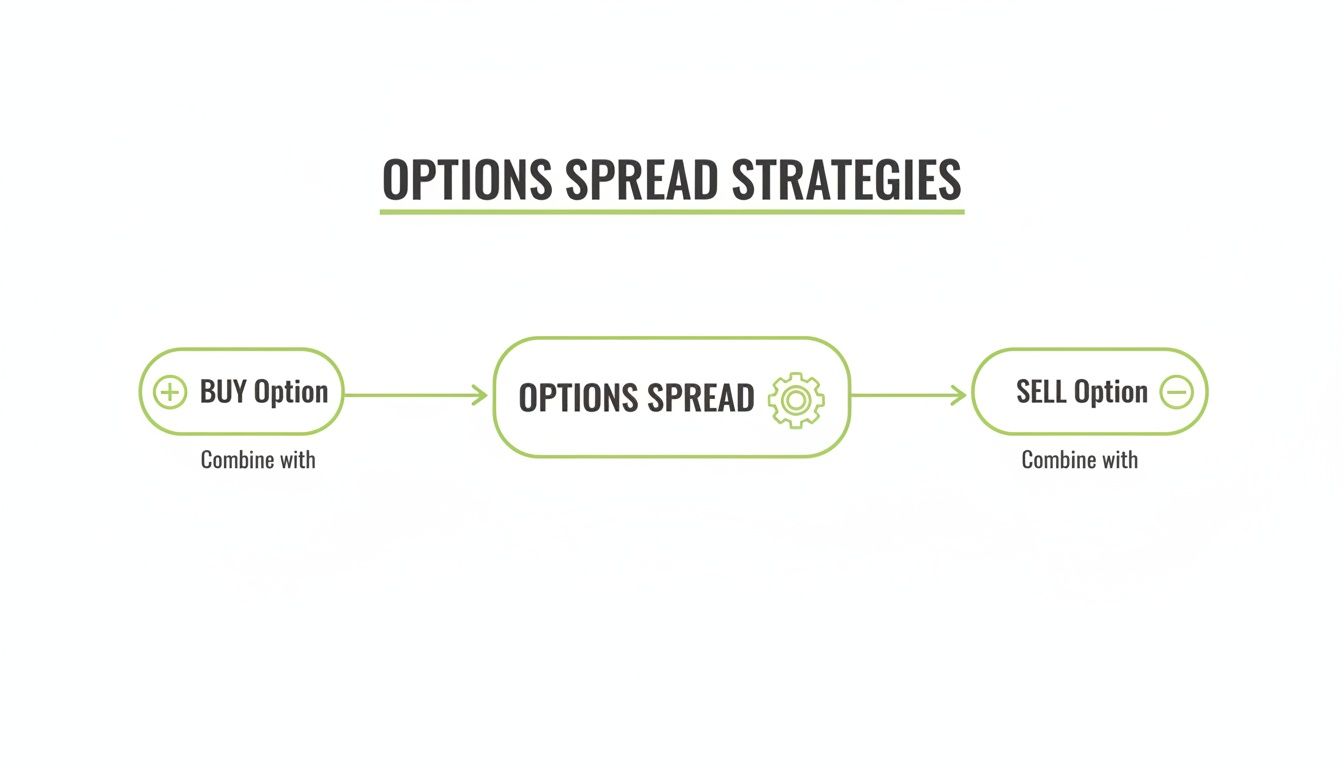
This simple act of combining a long and short option turns a raw bet into a strategic position with clearly defined risk and reward. Let's break down the three fundamental ways these positions get built.
Vertical Spreads: Playing the Price Game
A vertical spread is the most common and straightforward type. With this strategy, you buy and sell options that have the same expiration date but different strike prices.
It’s like betting on a stock to land within a specific price window by a certain date. You’re not just saying, "I think this stock will go up." Instead, you’re making a more refined statement: "I think this stock will finish above Price A but below Price B."
Why "vertical"? The name comes from how the strike prices are stacked vertically on an options chain for any given expiration date. Since the only thing that differs is the strike price, these spreads are designed to profit purely from the underlying stock's price movement.
There are four basic flavors of vertical spreads:
- Bull Call Spread: A bullish strategy where you buy a call and sell another call at a higher strike.
- Bear Call Spread: A bearish or neutral play where you sell a call and buy a higher-strike call for protection.
- Bull Put Spread: A bullish or neutral strategy where you sell a put and buy a lower-strike put.
- Bear Put Spread: A bearish trade where you sell a put and buy a put at an even lower strike price.
For a deeper dive into the most popular bullish version, check out our detailed guide on vertical call spreads.
Horizontal Spreads: Playing the Time Game
Next up are horizontal spreads, which you’ll often hear called calendar spreads or time spreads. Here, you buy and sell options with the same strike price but different expiration dates.
The whole idea is to profit from the passage of time and the effect of time decay (theta). We know that options lose value as their expiration date gets closer, but they don't all decay at the same speed. A horizontal spread is built to exploit the fact that short-term options melt away much faster than long-term ones.
By selling a front-month option (which decays quickly) and buying a back-month option (which decays slowly), you create a position that can make money even if the stock price doesn't move an inch.
This makes horizontal spreads a fantastic tool for a neutral market outlook when you expect the stock to trade sideways for a bit. You're basically selling time at retail prices and buying it back at wholesale.
Diagonal Spreads: The Hybrid Approach
Finally, we have the diagonal spread, which blends elements of both vertical and horizontal spreads. With this structure, you buy and sell options that have different strike prices AND different expiration dates.
This hybrid approach gives you incredible versatility. You can structure a diagonal spread to be bullish, bearish, or neutral, and it profits from a mix of both directional movement and time decay. It’s like playing the price game and the time game all at once.
A classic example is selling a short-term, out-of-the-money call against a long-term, in-the-money call you already own. This lets you collect income from the short call while giving your long call more time to grow in value.
Because they have two moving parts—strike and time—diagonal spreads are generally seen as a more advanced strategy. But don't let that intimidate you. They’re just a logical extension of the first two concepts, blended together to create a unique risk and reward profile.
Credit Spreads Versus Debit Spreads
Every options spread boils down to one simple question: does money come into your account, or does it go out? This single distinction separates all spreads into two major families: credit spreads and debit spreads. Getting this right is crucial because it dictates how you profit and what kind of market you're looking for.
Think of it like running a business. With a credit spread, you’re the manufacturer. You create and sell a product—the spread—and collect cash immediately. Your goal is simple: keep the money you collected.
A debit spread, on the other hand, makes you the retailer. You spend money upfront to buy inventory—the spread itself—hoping its value will increase so you can sell it for a profit later.
Credit Spreads: The Premium Collector
When you open a credit spread, you receive a net premium. This happens because the option you sell has a higher premium than the option you buy. That cash hits your brokerage account the moment you place the trade.
Your objective is for the options to expire worthless. If they do, you keep the entire premium as your maximum profit. This is why credit spreads are often called "income strategies." You're essentially selling time and probability, and you win if the underlying stock behaves—usually by not moving dramatically against you.
A credit spread is a high-probability strategy where your main goal is to collect and keep the initial premium. You profit from time decay and the stock price staying within a favorable range.
Debit Spreads: The Value Buyer
Conversely, a debit spread requires you to pay a net premium to open the position. This occurs because the option you buy is more expensive than the one you sell. This initial payment, or debit, is the absolute most you can lose on the trade.
With a debit spread, you need the value of the spread itself to increase. That means you need the underlying stock to make a significant move in your favor. Here, time decay is your enemy, eating away at your position's value every single day. You're buying something you hope becomes more valuable, just like buying a stock and hoping it goes up.
This fundamental difference in cash flow and objective is a critical concept for any trader to grasp. Our complete guide on the credit spread vs debit spread provides more examples to help solidify your understanding.
Credit Spreads vs Debit Spreads Key Differences
To make it even clearer, let's put the key differences side-by-side. This helps traders quickly decide which spread type aligns with their market outlook and risk tolerance.
| Attribute | Credit Spreads | Debit Spreads |
|---|---|---|
| Cash Flow | Receive a net credit (money in) | Pay a net debit (money out) |
| Primary Goal | Keep the initial premium | Profit from an increase in the spread's value |
| Max Profit | The net credit received | Difference between strikes minus the net debit |
| Max Loss | Difference between strikes minus the credit | The net debit paid |
| Time Decay (Theta) | Helpful (you profit as time passes) | Harmful (your position loses value over time) |
| Implied Volatility | Best sold when IV is high (premiums are rich) | Best bought when IV is low (premiums are cheap) |
Ultimately, both strategies serve different purposes but share a common, powerful benefit: defined risk.
Instead of the potentially huge or even uncapped risk of selling a naked option, spreads give you a clear, quantifiable outcome from the start. This completely changes how much capital your broker requires you to hold. For example, a put credit spread that brings in a $1.50 credit on a 10-point wide spread has a maximum loss of just $8.50 per contract, fixed from the moment you enter the trade. You can explore more about how exchanges view this risk reduction in resources from CME Group on capital efficiency.
Visualizing Your Trades with Payoff Diagrams
Theory is one thing, but to really get an options spread, you need to see it in action. Payoff diagrams are the best tool for this, hands down. They turn abstract numbers into a simple, visual map of your potential profit, loss, and breakeven points. It's like a cheat sheet for all the "what if" scenarios.
Let's walk through four of the most common spread strategies. We'll use real-world scenarios and their payoff diagrams to show you exactly how they work. This is the fastest way to understand the defined-risk magic of spreads.

Bull Call Debit Spread
This is a trader's go-to when they're moderately bullish on a stock but want to keep their upfront cost low and know their exact risk.
Scenario: Let's say stock XYZ is trading at $98. You think it’ll climb past $100 in the next month, but you don't want to fork over the full premium for a standard $100 call. You want a cheaper entry with a safety net.
- The Trade:
- Buy one $100 strike call for a $3.00 premium.
- Sell one $105 strike call for a $1.00 premium.
You’ve just created a spread for a net cost—or debit—of $2.00 ($200 per contract). That $200 is the absolute most you can lose. The payoff diagram looks like a flat-bottomed chair, clearly showing your capped risk and reward.
Here's how it plays out at expiration:
- Maximum Profit: If XYZ closes at or above $105, you hit your max profit of $300. That's the $5 difference between the strikes, minus the $2 you paid to get in.
- Maximum Loss: If XYZ closes at or below $100, you lose the $200 premium you paid. No more, no less.
- Breakeven Price: Your trade is flat when XYZ hits $102 (your lower strike price + the net debit).
Bear Put Debit Spread
The bear put spread is the mirror opposite of the bull call. You use it when you're moderately bearish and expect a stock to fall, but you want a cheap, risk-defined way to play the downside.
Scenario: Stock ABC is trading at $52. You've got a hunch it's going to drop below $50 soon, but buying a put outright feels too expensive.
- The Trade:
- Buy one $50 strike put for $2.50.
- Sell one $45 strike put for $0.75.
Your net cost (and maximum loss) is just $1.75 ($175 per contract). The payoff diagram is simply an upside-down version of the bull call spread, showing a clear floor on your loss and a ceiling on your profit.
Payoff diagrams eliminate the need for mental gymnastics. They give you an immediate, intuitive snapshot of a trade's risk, showing you exactly where you make money, where you lose it, and where you're safe.
Bull Put Credit Spread
Now we're getting into credit spreads, which are all about generating income. A bull put spread is perfect when you're neutral to bullish and feel confident a stock will stay above a certain price.
Scenario: Stock QRS is trading at $210. You aren't necessarily expecting a massive rally, but you're pretty sure it won't drop below $200 in the next few weeks. You want to get paid for that conviction.
- The Trade:
- Sell one $200 strike put for $4.00.
- Buy one $195 strike put for $2.50.
This trade puts an instant net credit of $1.50 ($150 per contract) into your account. That $150 is your maximum possible profit.
The payoff diagram makes your goal crystal clear: you want the stock to stay above your breakeven point so the options expire worthless, letting you pocket the entire premium.
- Maximum Profit: Your $150 credit is yours to keep if QRS closes anywhere at or above $200.
- Maximum Loss: Your max loss is capped at $350 (the $5 spread width minus the $1.50 credit you received).
- Breakeven Price: You only start losing money if QRS drops below $198.50 (the short strike minus your credit).
Bear Call Credit Spread
Last but not least, the bear call credit spread is your tool when you're neutral to bearish. You win if the stock stays below a specific price, making it a high-probability play on stocks that are stuck in a range or slowly drifting downward.
Scenario: Stock LMN is sitting at $78. You think the odds of it rallying past $85 by expiration are slim to none.
- The Trade:
- Sell one $85 strike call for $2.00.
- Buy one $90 strike call for $0.50.
You collect a net credit of $1.50 ($150), and that's your max profit. The payoff diagram shows that as long as LMN behaves and stays below $85, you're in the clear. With this strategy, time decay is your best friend, eating away at the value of the options you sold every single day.
How Spreads Evolve from Simpler Strategies
If you already get the hang of covered calls or cash-secured puts, you're just one small step away from trading spreads. Spreads aren't some exotic, complicated strategy—they’re often just the next logical move to make those simpler trades more efficient and less risky.
Think of it like adding a safety feature to a car you already know how to drive. It doesn't change how you operate the vehicle, but it gives you crucial protection if things go wrong.
Many traders start out selling cash-secured puts or covered calls to generate some steady income. And they work great. But they also come with big obligations: either having enough cash on hand to buy 100 shares or owning the shares outright. Spreads take those exact same positions and add a protective "leg" to put a hard cap on your risk.
From Cash-Secured Put to Bull Put Spread
Let's start with a classic cash-secured put. You sell a put option and keep enough cash in your account to buy the stock if the price drops below your strike. Your goal is for the stock to stay above that strike so you can just pocket the premium.
- The Original Trade (Cash-Secured Put): You sell one XYZ $50 put. You collect a nice premium, but you're now on the hook to buy 100 shares at $50 each if the stock tanks. Your max loss is huge—almost $5,000 if the company goes belly-up.
Now, let's turn this into a spread by adding a layer of insurance.
- The Evolution (Bull Put Credit Spread): You sell one XYZ $50 put and—at the exact same time—you buy one XYZ $45 put for a smaller premium.
By buying that cheaper $45 put, you’ve just created a floor for your potential loss. If the stock crashes down to $30, that long $45 put you bought kicks in and protects you from any more downside. You’ve officially transformed a simple income play with unlimited risk into a defined-risk credit spread.
The best part? Your capital is no longer tied up securing the full $5,000 potential purchase. It's now only securing the maximum loss of the spread itself, which is just a fraction of the original commitment.
An options spread often starts with a strategy you already know—like selling a put—and adds a long option to act as an insurance policy. This simple addition caps your maximum loss and dramatically improves capital efficiency.
From Covered Call to a Protective Collar
The very same idea works for covered calls. With a standard covered call, you own 100 shares of a stock and sell a call option against them. You get paid a premium, but you’re still exposed to all the downside risk of holding that stock. If it crashes, you crash with it.
But what if you could protect those shares from a steep drop while still collecting that income? That’s where a collar comes into play. A collar is a three-part position that basically builds a spread right around your stock.
- Own 100 Shares: This is your starting point.
- Sell an Out-of-the-Money Call: The normal covered call part that brings in the cash.
- Buy an Out-of-the-Money Put: This is the new piece. You use some of the premium from the call you sold to buy a put, which acts as your insurance policy against a market dive.
This structure locks your stock into a defined price range, putting a ceiling on your potential gains but, more importantly, a floor under your potential losses. It evolves the covered call from a straightforward income play into a smart hedging strategy.
This principle of adding protective legs isn't just a retail trader trick; it's fundamental to modern finance. Huge institutional desks use collars and other spread structures to manage risk across massive portfolios. In fact, global options and futures contract volumes have soared into the multi-billions in recent years, with spreads being a key tool for both hedging and speculation. You can see the scale of these markets for yourself in reports from the Bank for International Settlements.
Understanding this evolution is your key to becoming a much more strategic trader.
Using Probability and Volatility to Your Advantage
Successful spread trading isn’t about gazing into a crystal ball. It’s about playing the odds. When you learn to manage probabilities, you stop reacting to the market and start anticipating its likely moves—shifting from pure guesswork to a calculated strategy.
Two forces are at the heart of this approach: probability and implied volatility. Getting a handle on how these two interact is the key to consistently profiting with spreads.
The Role of Probability in Spread Selection
Every single options trade has a statistical chance of making money. We call this the Probability of Profit (POP), and it estimates the likelihood that your trade will be profitable by at least $0.01 when it expires. For a spread trader, this number is gold.
Credit spreads, for example, are built to be high-probability plays. If you sell a bull put spread way below the current stock price, you might see a POP of 80% or even higher. Statistically, that gives you a fantastic shot at keeping the entire premium you collected.
But there’s no free lunch in trading. High probabilities always come with a trade-off: smaller potential rewards.
A trade with a 90% chance of success will naturally offer a much smaller premium than a riskier trade with a 40% POP. Your job as a trader is to find the right balance between the likelihood of winning and the size of the payout.
Tools like Strike Price crunch the market data for you, calculating these probabilities on the fly. This lets you see the exact risk-reward balance for any trade you’re considering. To dig deeper into how the math works, check out our guide on the Probability of Profit for options.
Leveraging Implied Volatility
The other piece of the puzzle is implied volatility (IV). Think of IV as the market’s “fear gauge.” It tells you how big of a price swing the market is expecting in the future. When IV is high, option premiums get expensive. When it's low, they get cheap.
This directly shapes which type of spread makes the most sense:
- High IV Environments: This is a seller's market. Inflated option premiums make it the perfect time to sell credit spreads. You're collecting more cash for taking on the same amount of risk.
- Low IV Environments: This is a buyer's market. Cheaper premiums make it an ideal time to buy debit spreads. Your upfront cost is lower, which juices your potential return on investment.
When you align your strategy with the current volatility environment, you give yourself a real statistical edge. Selling spreads when premiums are rich and buying them when they're cheap is a core principle of professional options trading. It's how you consistently put the odds in your favor.
Frequently Asked Questions About Options Spreads
Diving into spreads always brings up a few practical questions. Let's tackle some of the most common ones so you can trade with more confidence.
Can I Trade Spreads in a Retirement Account?
Yes, you often can. Most brokers will let you trade spreads in retirement accounts like an IRA, but you’ll usually need a specific options approval level to do it.
Because spreads have a defined, capped risk, they're generally permitted. You'll just have to apply and show you understand the strategies you plan to use.
What Happens if One Leg of My Spread Is Assigned Early?
It's not common for most spreads, but early assignment can happen, especially with American-style options.
If the short leg of your spread gets assigned, you’ll be on the hook to either deliver shares (for a short call) or buy shares (for a short put). From there, you can close out the long leg of your spread to flatten the position. Many brokers will even automatically exercise your long option for you if it's in-the-money at expiration.
How Are Options Spreads Taxed?
Typically, any profits you make from options spreads are treated as capital gains. The exact tax implications can get tricky and often depend on how long you held the position and the specific structure of your trade.
For traders wanting to get a handle on the financial side of a winning trade, it's smart to know how those profits might be taxed. You can find general guides on the topic, like this overview of Capital Gains Tax Calculation in Australia, but remember that the rules are different everywhere.
It’s always a good idea to chat with a qualified tax professional. They can give you advice based on your personal financial situation and where you live.
Ready to stop guessing and start making data-driven decisions? Strike Price provides real-time probability metrics and smart alerts to help you build safer, more profitable covered call and cash-secured put strategies. Transform your options trading today at strikeprice.app.