A Trader’s Guide to How to Read Option Chains
If a stock moves past your strike, the option can be assigned — meaning you'll have to sell (in a call) or buy (in a put). Knowing the assignment probability ahead of time is key to managing risk.
Posted by
Related reading
A Step-by-Step Covered Calls Example for Consistent Income
Unlock consistent income with our step-by-step covered calls example. This guide breaks down the strategy, risks, and outcomes to help you trade confidently.
Long Call and Short Put The Ultimate Synthetic Stock Guide
Unlock the power of the long call and short put strategy. This guide explains how synthetic long stock works, its benefits, risks, and how to execute it.
What is a Call Spread? A Clear Guide to Bull and Bear Spreads
What is a call spread? Discover how bull and bear spreads limit risk and sharpen your options trading strategy.
Reading an option chain is really just about learning to decipher a table full of contracts for a particular stock. It's about spotting the key data points—like strike prices, expiration dates, and the constant tug-of-war between calls and puts—to get a feel for what the market is thinking.
Metrics like volume and open interest are your clues to finding real trading opportunities.
Decoding the Option Chain: What You’re Actually Seeing
At first glance, an option chain can feel like staring at a dense spreadsheet from a finance textbook. Don’t let it intimidate you. In reality, it’s a live, dynamic map of the market's expectations for a stock.
It tells you what traders are betting on, how much they're willing to pay, and when they think a move will happen. The whole point is to learn how to read this map so you can make your own informed decisions.
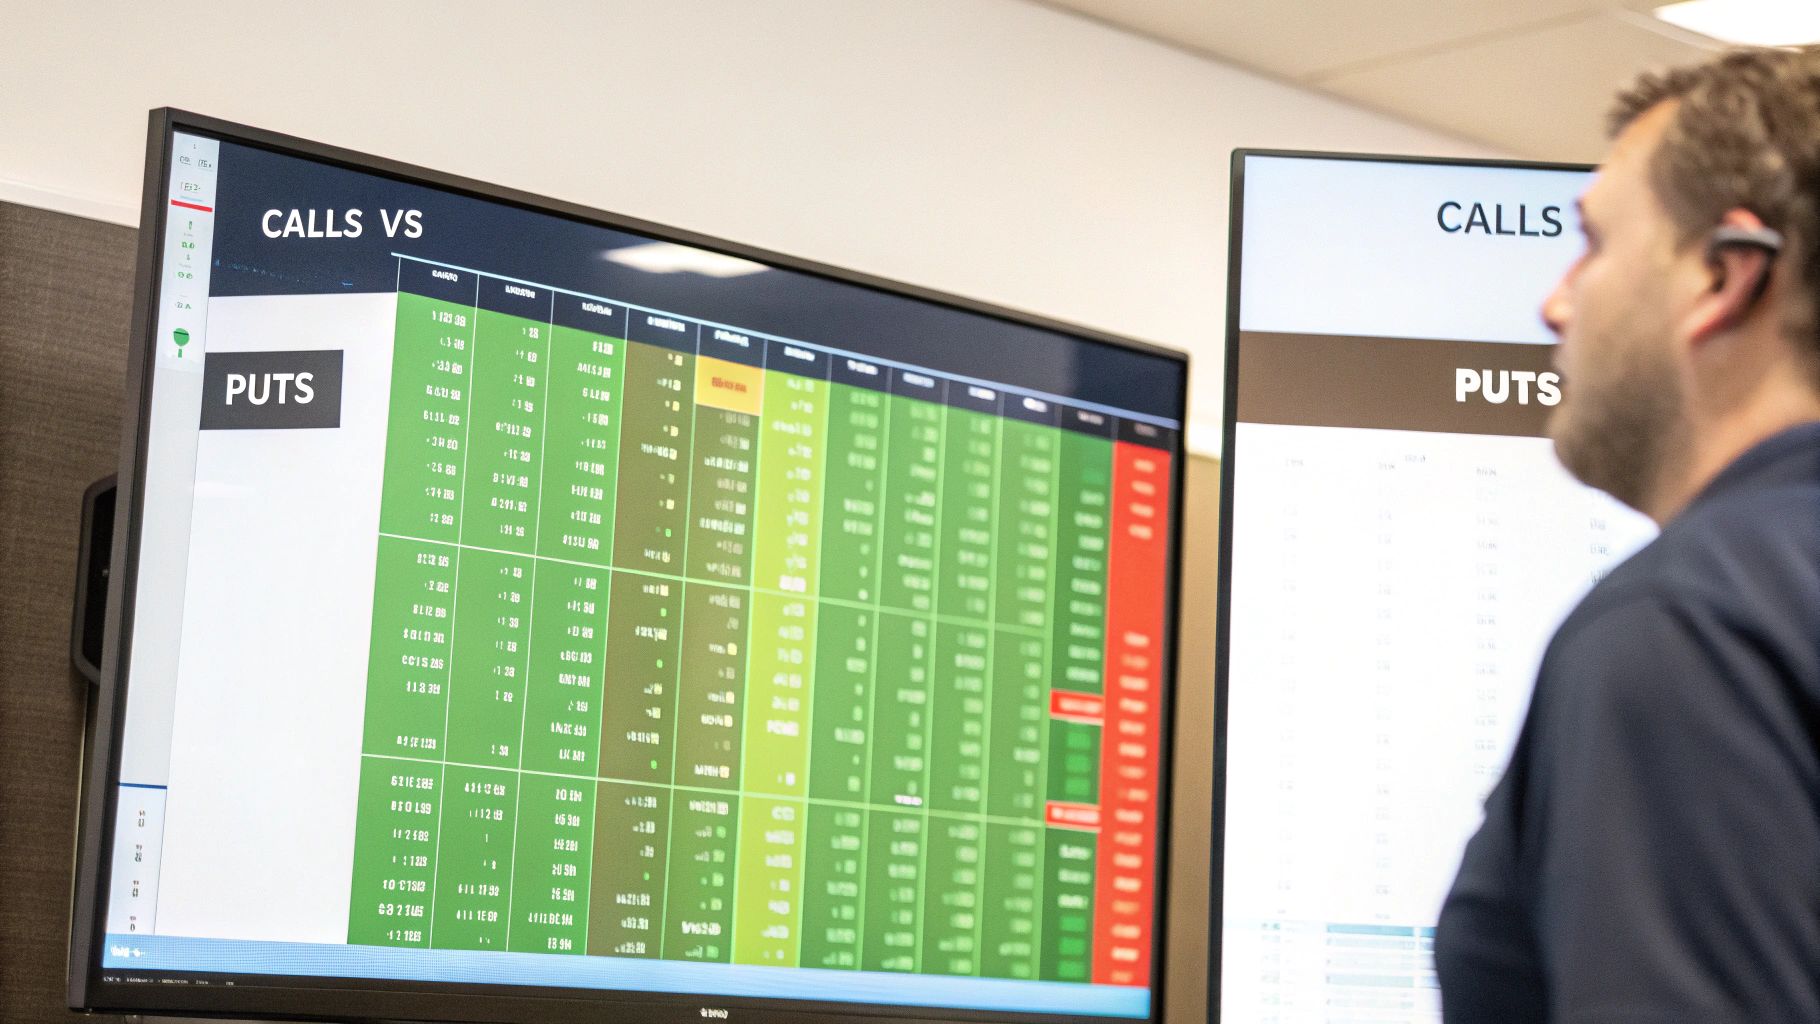
Your first step is to get the lay of the land. The chain is split into two sides:
- Calls are typically on the left. Think of these as bullish bets. They give the owner the right to buy the stock at a set price. If you think a stock is headed up, this is where you’ll be looking.
- Puts are usually on the right. These are the bearish bets, giving the owner the right to sell the stock at a set price. If you’re anticipating a drop, puts are your tool.
This simple layout immediately separates the bullish crowd from the bearish one. For a more detailed breakdown, check out our complete guide on how to read an option chain.
Before we get any deeper, let's quickly review the absolute basics with a simple cheat sheet.
Key Option Chain Terminology at a Glance
| Term | What It Means | Why It's Important |
|---|---|---|
| Strike Price | The price at which the option can be exercised (bought or sold). | This is the anchor of the contract. All other data is relative to the strike price. |
| Expiration Date | The date the option contract becomes void. | Determines the contract's lifespan—crucial for short-term vs. long-term strategies. |
| Calls | Contracts giving the right to buy the underlying stock. | Used for bullish strategies; their value increases as the stock price rises. |
| Puts | Contracts giving the right to sell the underlying stock. | Used for bearish strategies; their value increases as the stock price falls. |
| Bid/Ask | The prices at which you can sell (bid) or buy (ask) the option. | The spread between these two prices indicates the option's liquidity. |
| Volume | The total number of contracts traded on the current day. | A high volume signals strong interest and liquidity, making it easier to enter/exit trades. |
| Open Interest | The total number of outstanding contracts that have not been settled. | Shows the depth of the market and the level of commitment from other traders. |
This table covers the essentials you'll see on every chain. Now, let's put them into context.
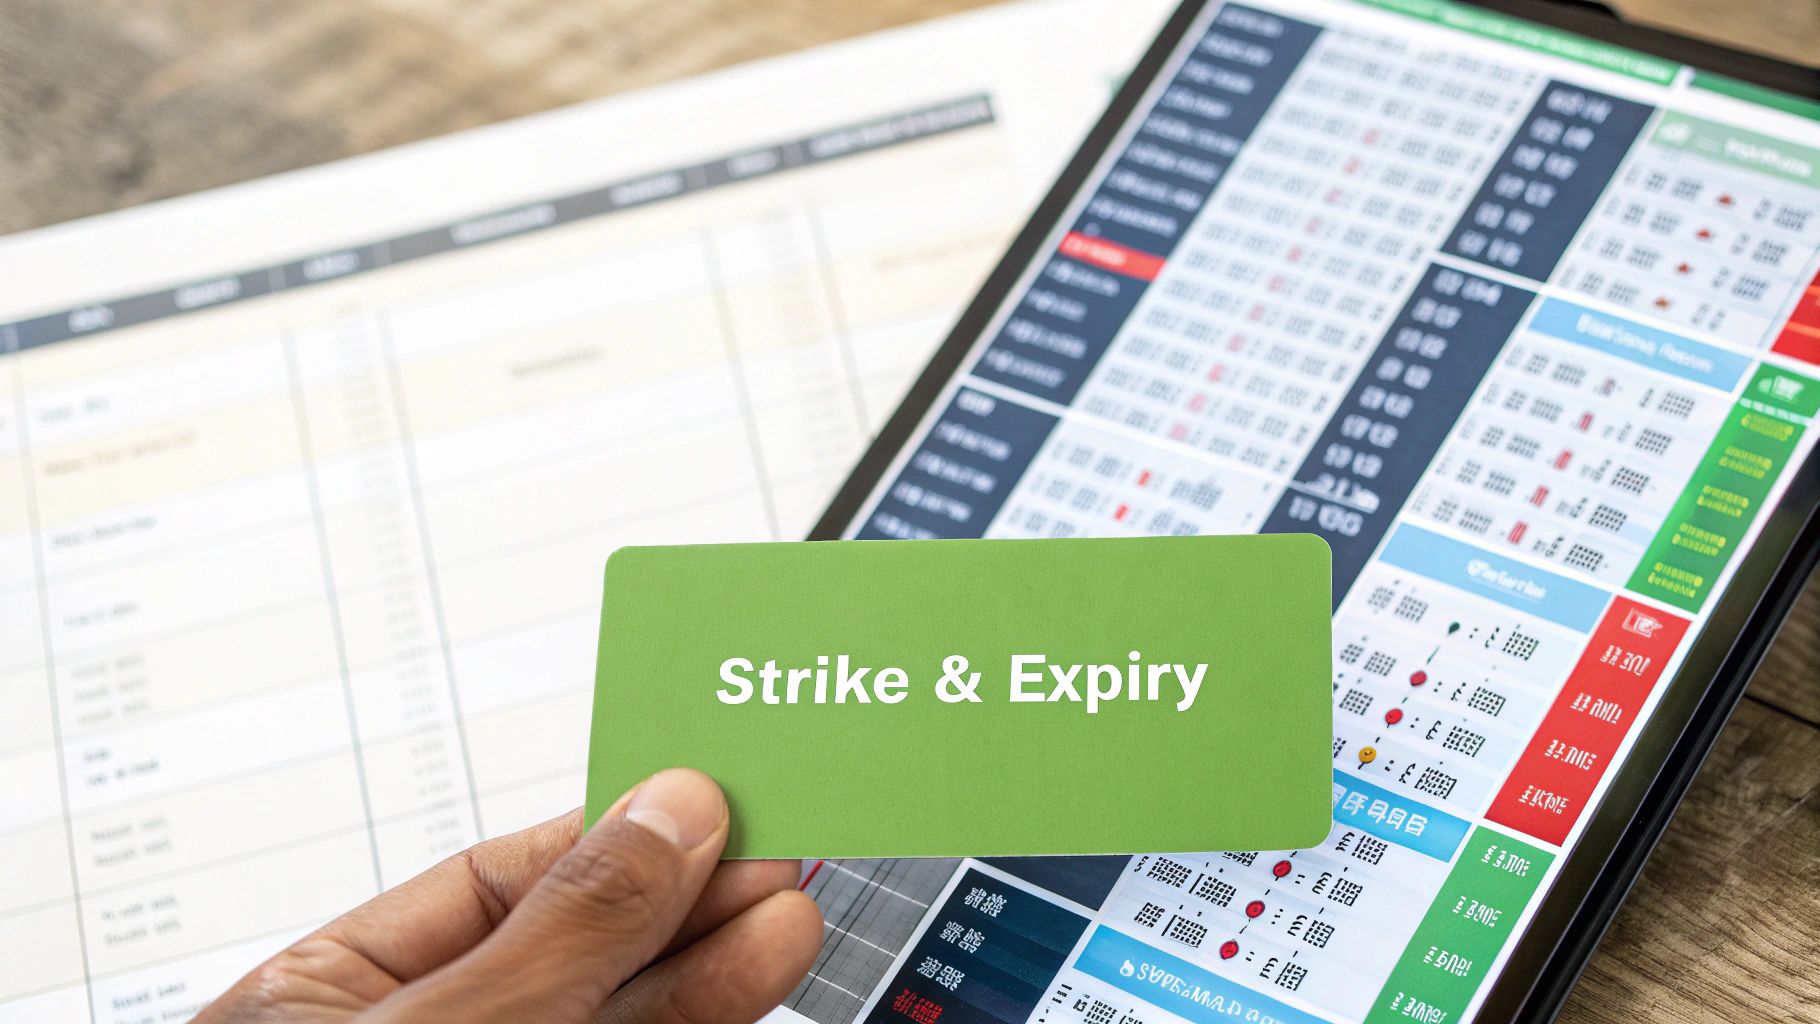
The Core Components: Expiration and Strike Price
Every option chain is built around two fundamental elements: the expiration date and the strike price.
The expiration dates are usually listed right at the top, and they define how long the contract is valid. A trader looking to play an earnings report might pick a weekly option that expires in a few days. On the other hand, someone positioning for a long-term trend might look at monthly or even yearly options.
The strike price is the backbone of the entire chain. It’s the vertical column running down the center, acting as the reference point for everything else.
An option chain is a real-time snapshot of all available contracts, showing you prices and key stats for calls and puts across different strikes and expirations. It's the raw data you need to understand where the market's head is at.
Here’s a look at a standard option chain for the SPY ETF. You can see calls on the left and puts on the right, all organized by their strike price.
:max_bytes(150000):strip_icc()/Option_Chain_Final-6f8e7a3328e348a786a51d45127ab8c9.jpg)
See that shaded area? That highlights the "in-the-money" options—the ones that already have intrinsic value. The unshaded area shows the "out-of-the-money" options.
Within these columns, you’ll find the trading volume, which tells you how much interest and liquidity there is for a specific contract. The Chicago Board Options Exchange (Cboe) reports millions of contracts traded daily, and metrics like the put/call ratio give you a direct glimpse into the market's mood. You can even check out the Cboe's market statistics yourself for a deeper dive.
Finding Your Edge with Strike Prices and Spreads
The strike price is where your trading theory meets the real world. It's the exact price where you're betting a stock will land—either above or below—and picking the right one is a mix of art and science. This single decision shapes your potential profit, your risk, and how much you'll pay to enter the trade.
Just knowing the textbook definitions of "in-the-money" (ITM), "at-the-money" (ATM), and "out-of-the-money" (OTM) won't cut it. The real skill is understanding the strategic trade-offs each one presents.
The Strategic Choice Between ITM and OTM
Think of it as a constant tug-of-war between probability and cost.
An in-the-money (ITM) option already has built-in value, which naturally makes it more expensive. For a call, the strike is already below the current stock price; for a put, it's above.
So why pay the higher price? Because it gives you a much better chance of finishing in the money. A trader who is confident a stock is headed up but wants a safety net might buy an ITM call. It's a higher-conviction play that gives you a buffer if the stock's move isn't as big as you hoped.
On the flip side, an out-of-the-money (OTM) option is cheap because it’s pure speculation. It has zero intrinsic value. When you buy a far OTM call, you're not just betting the stock will go up—you're betting it will go up a lot, and fast. It's the classic low-cost, high-risk, high-reward trade that requires a massive move just to break even.
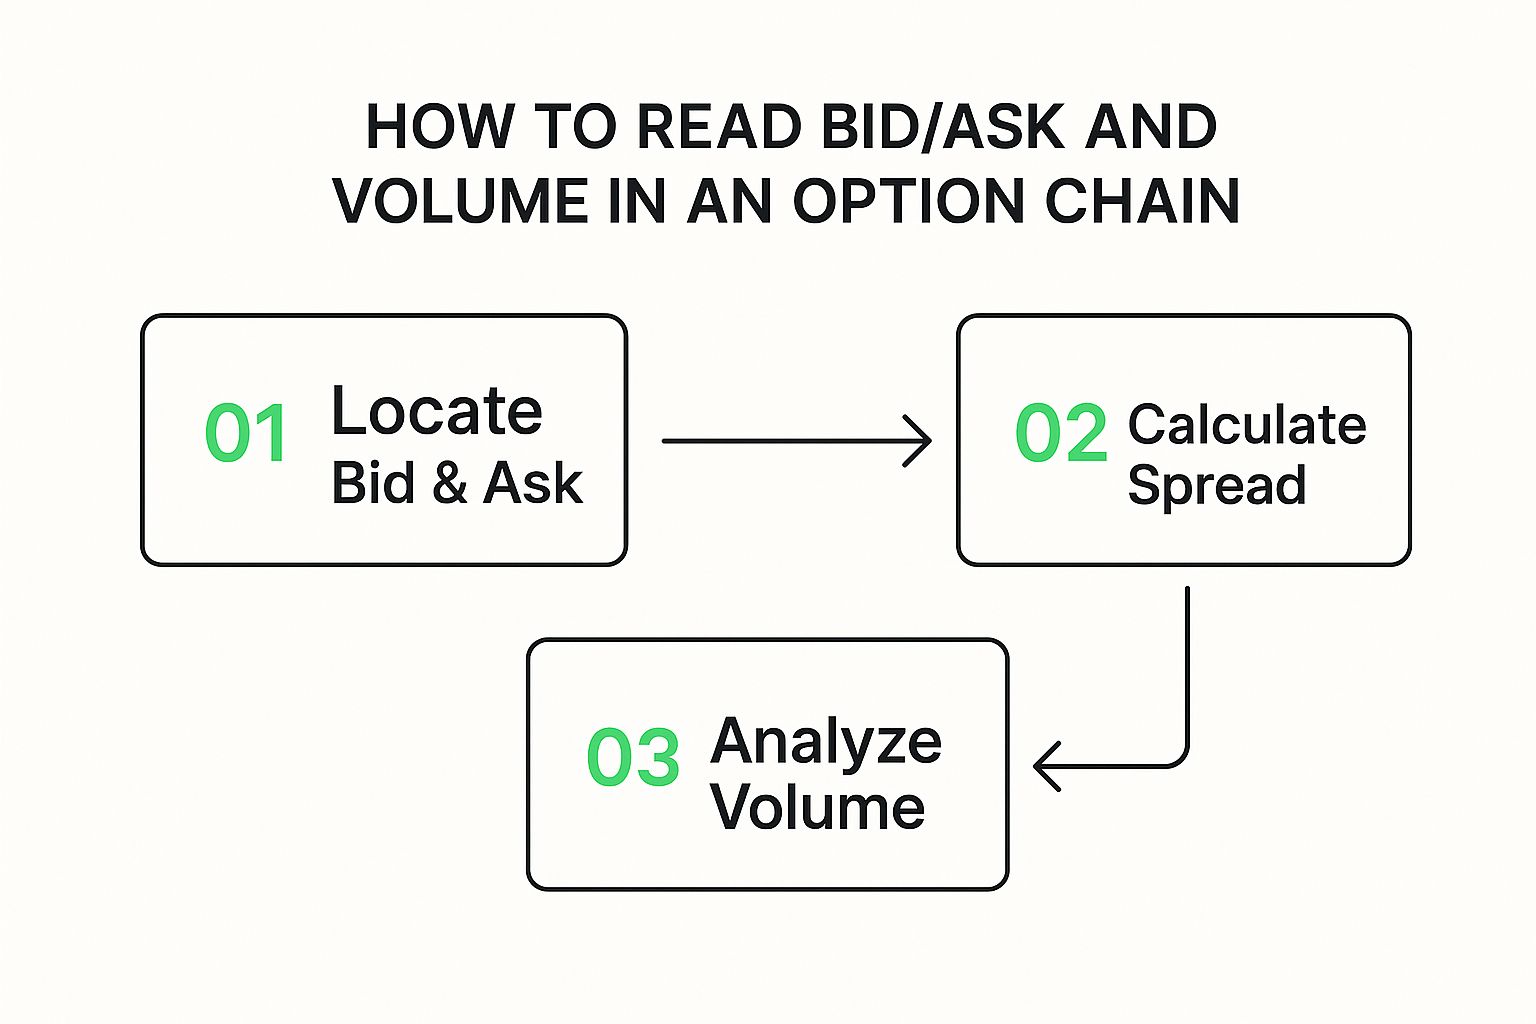
The Unspoken Cost of the Bid-Ask Spread
Once you've zeroed in on a potential strike, the very next thing you need to check is the bid-ask spread. This is that little gap between what buyers are willing to pay (the bid) and what sellers are willing to accept (the ask).
That spread isn't just noise; it's the hidden transaction cost you pay for the privilege of trading.
A wide bid-ask spread is a huge red flag. It’s a clear sign of low liquidity, meaning there aren’t many buyers or sellers. This makes it tough to get into a trade at a fair price and, more importantly, a nightmare to get out.
What you want to see is a tight spread, often just a penny or two. That’s the green light. It tells you there's a healthy, competitive market for that contract. In my experience, high volume and deep open interest almost always mean you'll find tight spreads, because tons of other traders are active there.
For instance, a bid of $1.50 and an ask of $1.52 gives you a tiny $0.02 spread. That’s a liquid option. But if you see a bid of $1.50 and an ask of $1.80, that’s a $0.30 spread—a major warning. Entering that trade means you're already starting in a $0.30 hole.
By paying close attention to both your strike's strategic position and the liquidity shown by the spread, you stop being a passive observer and start making sharp, calculated decisions.
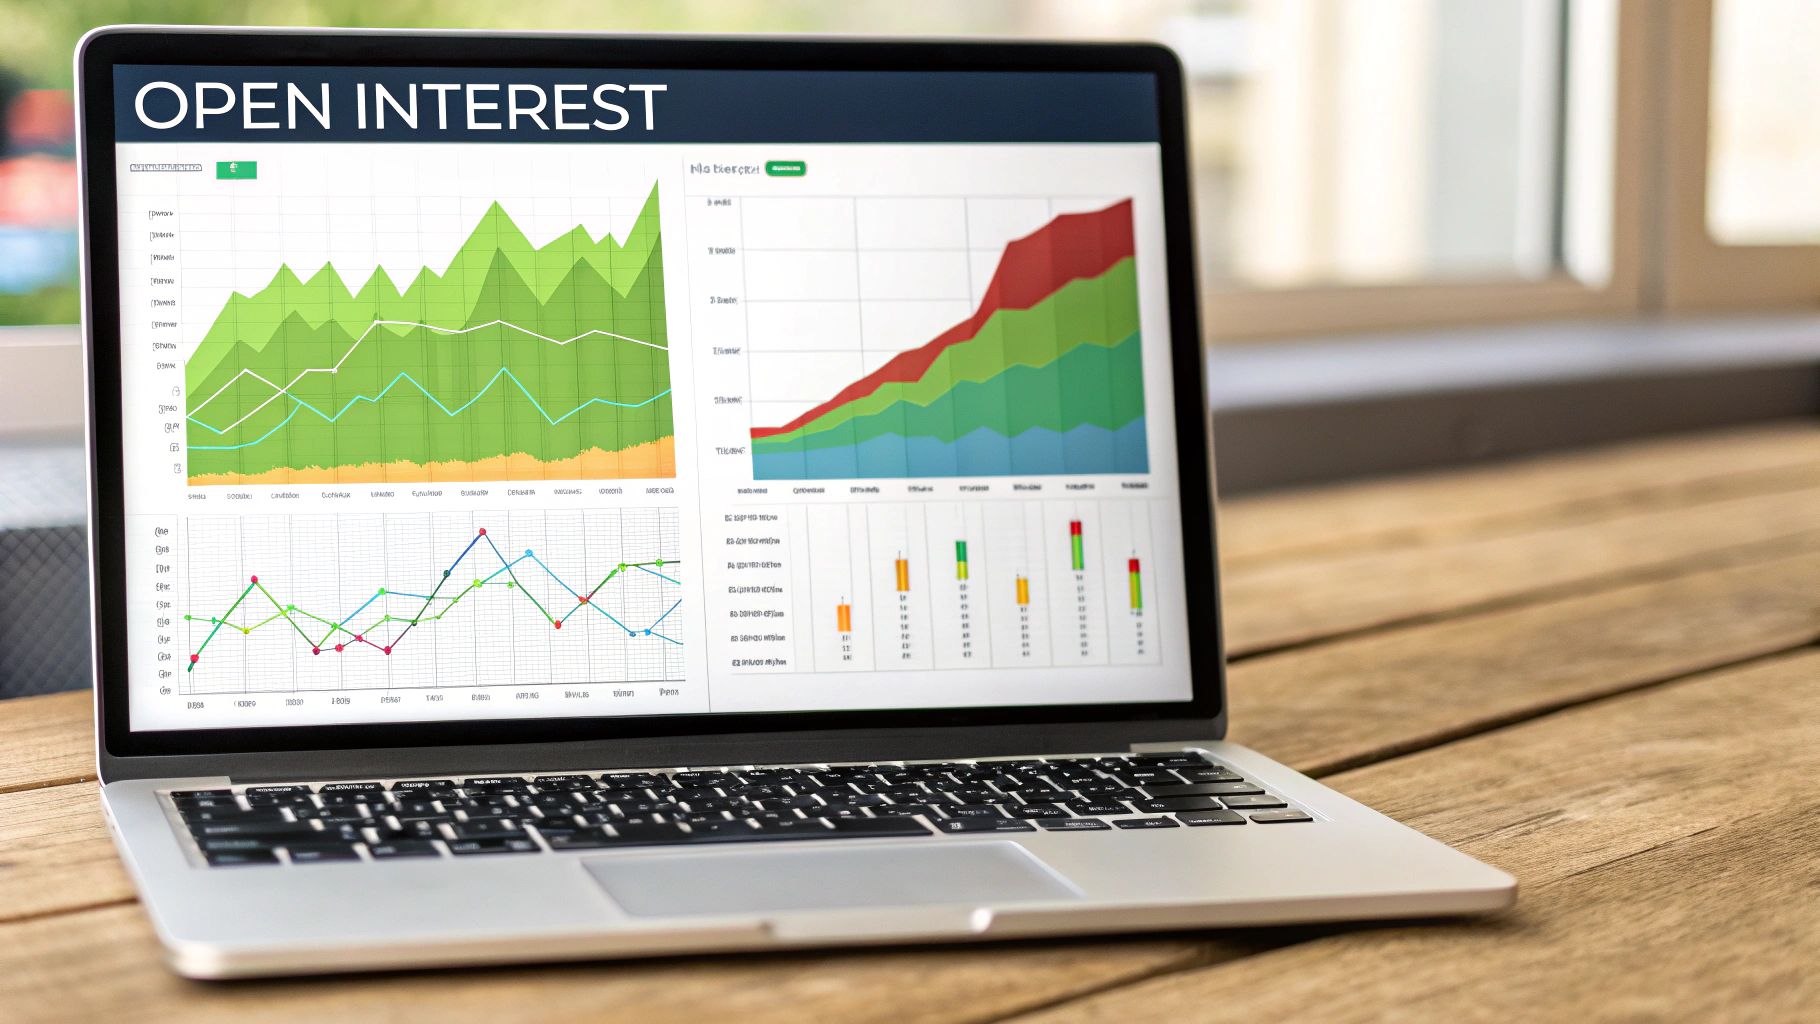
Gauging Market Conviction with Volume and Open Interest
If strike prices and spreads are about finding a tactical entry, volume and open interest show you the market's strategic conviction. Think of these two metrics as a window into the collective mind of other traders. They tell a story about where the real money is moving and where people are willing to let their bets ride.
Volume is the day's chatter—the total number of contracts traded for a specific strike, today. It resets to zero every morning. High volume, especially on a day with a big move in the stock, points to strong, immediate interest.
Open interest, on the other hand, is the long game. It’s the total number of active contracts that haven't been closed or exercised yet. This number tells you how many bets are still on the table, showing where capital is committed over time.
Decoding the Relationship Between Volume and Open Interest
The real magic happens when you look at these two metrics together. They give you crucial context for what's happening with the stock's price and help you decide whether to trust or question a trend.
Here are a couple of common scenarios you'll see:
- Rising Volume + Rising Open Interest: This is your strongest confirmation signal, whether bullish or bearish. It means new money is flowing in as traders open fresh positions, essentially adding fuel to the fire.
- Rising Volume + Falling Open Interest: This is often a red flag for a trend reversal or exhaustion. Sure, there’s a lot of activity, but it’s mostly traders closing out their positions—either taking profits or cutting losses. The conviction is fading.
Think of it this way: Volume is today's conversation, while Open Interest is the total number of people in the room. If volume is high but open interest drops, it means people are closing positions and leaving the room, not opening new ones.
Using Open Interest to Spot Key Price Levels
One of the most practical ways to use open interest is to spot potential support and resistance levels. When you scan an option chain, keep an eye out for strike prices with unusually massive open interest. These clusters of contracts often act like psychological magnets for the stock price.
For example, a huge pile of open call contracts at the $150 strike might create a resistance level. As the stock gets close to $150, the traders who sold those calls might start selling the stock to hedge their position, creating downward pressure on the price.
The U.S. options market sees an average daily volume of over 50 million contracts, so analyzing these flows is critical. By watching where open interest and volume build up, you can often see where large positions are being established, which can precede a significant price move. You can dig into the data on exchange volume to see these dynamics play out across the market.
Managing Risk with the Option Greeks
Beyond the obvious price and volume numbers, an option chain is packed with a powerful set of risk metrics known as the Greeks. These aren't just for Wall Street quants; they're your real-time dashboard showing exactly how an option’s price will likely react to market shifts.
Frankly, understanding the Greeks is what separates guessing from strategically managing risk. Each one tells a different part of the story, giving you a much clearer picture of what you’re getting into.
Delta and Gamma: The Dynamics of Price Movement
First up is Delta, the one you’ll probably look at most often. It gives you a simple forecast: for every $1 the underlying stock moves, how much will your option’s price change?
So, if you’re looking at a call option with a Delta of 0.60, you can expect it to gain about $0.60 in value if the stock pops up by $1. Easy enough.
But Delta isn't set in stone. That's where Gamma comes into play. Gamma tells you how fast Delta itself will change as the stock moves. An option with high Gamma is like a sports car—it accelerates quickly. Traders who anticipate a sharp, sudden breakout often hunt for high-Gamma options because their directional bet gets stronger, faster.
Theta and Vega: The Invisible Forces of Time and Volatility
Every option has an expiration date, and time is literally money. Theta is the Greek that measures the cost of time, showing you how much value an option bleeds away each day. This “time decay” isn’t linear; it picks up speed like a runaway train as expiration gets closer. It’s the reason why holding onto a losing option "just in case" can be a very expensive mistake.
Last but not least is Vega, which measures an option's sensitivity to changes in implied volatility (IV). You can think of Vega as the "fear gauge." When the market gets jittery and IV spikes, options get more expensive. If your option has a high Vega, its price will react much more dramatically to these shifts in market sentiment.
The Greeks are the language of risk. If you're selling premium, you might want high Theta to collect that daily time decay. If you're speculating on a huge move, you might want high Gamma to juice your returns. It’s all about matching the option’s risk profile to your specific strategy.
Learning to read the Greeks moves you beyond just surface-level numbers. You're essentially looking under the hood to see what’s really driving an option's price.
For a much deeper dive into each of these and how to use them in your own trading, check out our complete guide where we fully explain the Greeks for options. Using them properly is how you stop just placing bets and start building a strategic position that truly fits your market outlook and what you’re willing to risk.
Reading Market Fear and Greed in Implied Volatility
Beyond the static numbers of price and volume, there's a powerful, forward-looking metric that acts as the market's pulse: Implied Volatility (IV). You'll find it on every option chain, and it's not a historical fact. It's a real-time forecast of how much a stock is expected to swing in the future.
Think of it as the collective guess of the entire market, priced directly into every single option.
I like to call IV the "fear and greed" gauge. When IV is high, the market is bracing for big, dramatic price moves. This is often driven by uncertainty, like an upcoming earnings report or major economic news. That heightened expectation makes options more expensive.
On the flip side, low IV suggests the market expects calm, predictable price action. This sense of stability makes options cheaper.
But the raw IV number itself is only half the story. A 40% IV might be sky-high for a stable utility stock but unusually low for a volatile tech company. This is where context becomes king.
Using IV Rank and Percentile to Find Your Edge
To make IV truly actionable, we need to know if it's high or low relative to its own history. This is where IV Rank and IV Percentile come into play. These metrics, available on platforms like Strike Price, compare the current IV to its range over the past year.
An IV Rank of 90%, for example, tells you that volatility is higher right now than it has been for 90% of the last 12 months. That’s a critical piece of intel. It helps you decide whether it's a better time to be an option buyer or a seller.
- Low IV Environment: When IV is historically low, options are cheap. This can be an ideal time for buyers who think volatility is about to pick up, which would pump up the value of their options.
- High IV Environment: When IV is historically high, options are expensive. This is generally a much better setup for sellers, who can collect a fatter premium with the expectation that volatility will eventually settle back down to its average.
Mastering implied volatility isn't just about reading a number; it's about interpreting the market's mood. High IV is fear, low IV is complacency. Your job is to position yourself to profit from whichever sentiment is currently overpriced.
Let's say you see a stock with an IV of 75%. That seems high, right? But what if its IV Rank is only 20%? This tells you that while 75% is a big number, it's actually on the low end for this particular stock. Understanding that distinction is absolutely crucial for picking the right strategy.
Learning the nuances of IV is a game-changer. It takes you from someone who just reads an option chain to a trader who truly understands the underlying market dynamics. To get a better grasp of the mechanics, check out our guide on how to calculate implied volatility and see what really drives this powerful metric.
Practical Answers to Common Option Chain Questions
As you start putting all these pieces together, a few common questions almost always pop up. Getting clear, practical answers can be the difference between confusion and confidence when you're staring at live market data.
Let’s dig into some of the most frequent hurdles traders face.
What's the Real Difference Between Volume and Open Interest?
One of the biggest sticking points is understanding Volume versus Open Interest. They sound similar, but they tell completely different stories about market conviction.
Think of it like this: Volume is today's conversation. It’s the raw count of how many contracts traded hands during the current session, and it resets to zero every single morning. High volume means there's a lot of chatter and activity right now.
Open Interest, on the other hand, is the total number of people in the room. It’s the cumulative count of all active contracts that haven't been settled or closed out yet. High open interest means a lot of traders have ongoing skin in the game for that specific option.
The real magic happens when you watch how they change together. If volume is high but open interest falls, it means the conversation is loud but people are leaving the room. Traders are closing their positions, not opening new ones, which often signals a trend is losing steam.
How Do I Pick the Right Strike Price?
Choosing a strike is always a balancing act between probability and cost. There's no single "best" strike—it all boils down to your strategy and how much risk you're comfortable with.
- In-the-money (ITM) options are more expensive upfront but have a higher probability of being profitable since they already have intrinsic value.
- Out-of-the-money (OTM) options are way cheaper but are a long shot. They need a significant move in the stock just to break even.
A great starting point for many traders is to look for options with a Delta somewhere between .30 and .70. More importantly, always check for high volume and open interest at your chosen strike. Good liquidity is crucial—it ensures you can get in and out of the trade easily and at a fair price.
Why Is My Option Losing Money if the Stock Is Flat?
Ah, the classic, frustrating work of "time decay," also known as Theta. Every option contract has an expiration date, and a huge chunk of its value comes from the time it has left.
As each day passes, a small piece of that time value vanishes forever. This happens even if the stock price doesn't move an inch.
And this decay isn't a slow, steady drip. It accelerates dramatically in the last 30-45 days before expiration. That's why holding a losing option for too long, just hoping it will turn around, can be a very expensive mistake. The clock is always ticking against the option buyer.
Ready to stop guessing and start making data-driven decisions? The Strike Price platform gives you real-time probability metrics for every strike, smart alerts for high-reward opportunities, and a clear dashboard to track your contracts. Turn theory into action and start selling options with confidence. Explore how Strike Price can transform your trading today.