How to Read an Option Chain A Practical Guide
If a stock moves past your strike, the option can be assigned — meaning you'll have to sell (in a call) or buy (in a put). Knowing the assignment probability ahead of time is key to managing risk.
Posted by
Related reading
A Practical Guide to Generating Income with Covered Call Options
Learn how to generate consistent income using covered call options. This guide breaks down the strategy, risks, and rewards with real-world examples.
Selling Naked Put (selling naked put): A Practical Guide to Income and Risk
Discover how selling naked put options can generate consistent income while managing risk. Practical strategies, real-world examples, and step-by-step guidance.
Risks of Covered Calls: risks of covered calls explained
Discover the risks of covered calls and how to navigate gains limits, assignment pitfalls, and smarter income strategies to protect your portfolio.
When you first pull up an option chain, you're essentially looking at a grid that tells you everything about the available contracts for a stock. It’s a real-time snapshot of market sentiment, neatly organized with call options on the left, put options on the right, and the strike prices running right down the middle.
This layout is universal for a reason—it lets you quickly size up the risk, potential reward, and where other traders are placing their bets.
Decoding the Option Chain: What Traders Actually See
An option chain might seem complex at first glance, but it's really just a well-organized menu of contracts for a specific stock and expiration date. Think of it as your command center for all potential trades.
Getting comfortable with its layout is the first major step. The chain gives you a direct look at the metrics that matter, from strike prices to volume and implied volatility. For deeper insights into these market stats, platforms like Cboe are an invaluable resource.
Here’s a look at a standard layout you’d find in most trading platforms.
:max_bytes(150000):strip_icc()/OptionChain-2c5053b8aeda4910b27712d92972989b.jpg)
This image highlights the key columns, showing how data like the last traded price, bid, ask, and volume are laid out for both calls and puts.
Key Option Chain Components at a Glance
Before we get into the nitty-gritty of each column, it helps to have a quick reference for the core components. Every piece of data tells a part of the story, from an option's current price to how much interest it's attracting from other traders.
If you want to go deeper, our comprehensive guide on how to read an options chain is the perfect next step.
Here’s a simple table that breaks down the essential terms you'll find on any option chain.
| Component | What It Represents | Why It Matters to Your Trade |
|---|---|---|
| Strike Price | The price at which you can buy or sell the underlying stock. | This is the centerpiece of your strategy, defining your entry or exit point. |
| Bid/Ask | The highest price a buyer will pay (Bid) and the lowest price a seller will accept (Ask). | The difference, or spread, directly impacts your transaction costs. |
| Volume | The number of contracts traded during the current day. | High volume indicates strong current interest and better liquidity. |
| Open Interest | The total number of outstanding contracts that have not been settled. | This shows the depth of market participation for that specific option. |
Think of these four components as the foundation. Once you have a solid grasp of what they mean, the rest of the chain starts to make a lot more sense.
Choosing Your Price and Timeline: Strike and Expiration

Alright, now that you know your way around the option chain, it’s time for the real strategy. It all boils down to two critical choices: the strike price and the expiration date.
These aren't just random numbers on a screen. Think of them as the fundamental levers you pull to define the risk, reward, and timeline of your entire trade. The strike price is simply the pre-agreed price where you can buy (for a call) or sell (for a put) the underlying stock.
Where’s Your Bet? The Strike Price
Your choice of strike price is basically your bet on where you think the stock is headed. Its relationship to the current stock price is everything, and it determines whether your option is in-the-money, at-the-money, or out-of-the-money. This status is your first clue to understanding its potential profit and risk profile.
- In-the-Money (ITM): A call option is ITM if its strike is below the current stock price. A put is ITM if its strike is above it. These options have real, tangible value, known as intrinsic value.
- At-the-Money (ATM): This is the strike price closest to the current stock price. ATM options are super sensitive to any small moves in the stock, making them popular for traders expecting immediate action.
- Out-of-the-Money (OTM): A call is OTM if the strike is above the stock price, and a put is OTM if its strike is below it. These are the cheapest options because they're made up entirely of extrinsic value—essentially, the hope that the stock will move favorably.
For instance, a classic strategy for covered call writers is to sell an OTM call. The goal here is to pocket the premium from a contract that’s less likely to be exercised, letting you keep both the cash and your shares.
Balancing Time and Opportunity
Just as crucial as the price is the timeline. The expiration date is the day your contract simply poofs and ceases to exist. On an option chain, you'll find everything from weekly contracts (often called "weeklies") to long-term options known as LEAPs, which can last more than a year.
Your choice here is a constant trade-off.
Shorter-dated options, like weeklies, are subject to rapid time decay (which we measure with the Greek letter Theta). Their value melts away incredibly fast, which can be fantastic if you're an option seller but a nightmare if you're a buyer on the wrong side of the clock.
On the other hand, longer-dated options give your trade more breathing room to work out, but they also cost more upfront.
Ultimately, matching the right strike with the right timeline is what turns a good idea into a well-executed trade. For a much deeper dive, our guide on how to choose an option strike price can help you perfectly align these choices with your trading goals.
Finding Where the Action Is: Volume and Open Interest

So you've narrowed down your strike price and expiration date. Great. But before you jump in, you need to see if anyone else is at the party. That’s where Volume and Open Interest come into play. These two columns are the lifeblood of the option chain, showing you exactly where the real money and attention are focused.
Volume is simple: it’s the total number of contracts that changed hands today. Think of it as a snapshot of the current buzz. A sudden spike in volume on a particular strike often means some news or a big sentiment shift has traders scrambling to get in or out right now.
Open Interest, on the other hand, is the total number of contracts that are still active and haven't been settled or closed. This gives you a much bigger picture of the market's commitment over time, showing how many positions are still being held from previous days. It's the long-term conviction.
What High Volume and Open Interest Tell You
The real magic happens when you look at these two metrics together. You're not just hunting for a big number in one column; you're looking for a story told by both.
- High Volume + High Open Interest: This is the sweet spot. It screams liquidity. Lots of buyers, lots of sellers. When an option is this active, you typically see tighter bid-ask spreads, which means you're not losing as much money just to get into the trade.
- Low Volume + Low Open Interest: Tread carefully. This is a ghost town. Low interest means poor liquidity. If you try to trade these, you could get stuck with a terrible price on entry and have an even harder time getting out. The spreads will likely be wide enough to drive a truck through.
Here’s a simple way to think about it: Volume is the crowd showing up for the concert today. Open Interest is the total number of tickets sold for the entire tour. When both are high, you know you’re at the main event.
Reading the Relationship Between Them
How these two numbers interact can give you some serious clues about market sentiment. For instance, if you see both volume and open interest climbing together, it's a strong sign that new money is pouring in, validating a potential trend.
But what if volume is high while open interest is dropping? That suggests traders are closing out their positions. The party might be winding down, and the trend could be losing steam.
As a practical rule of thumb, I always look for options with at least 100 contracts of open interest, though honestly, the more the better. This one little check helps ensure you’re stepping into a liquid market where you won’t get trapped.
Getting Into the Weeds: Bid, Ask, and the Greeks

While volume and open interest show you where the party is, the Bid and Ask prices tell you the cover charge. These two columns are the live, breathing market for that specific option contract. The Bid is the highest price a buyer is currently willing to pay, and the Ask is the lowest price a seller is willing to accept.
That little gap between the two is what traders call the bid-ask spread. A tight spread—just a penny or two—tells you the option is super liquid, making it easy to get in and out of a trade at a fair price. But a wide spread? That’s a red flag for poor liquidity. It means you're paying a premium just to get your order filled, which can eat into your profits from the get-go.
The Real Story Is in the Greeks
Beyond the sticker price, the "Greeks" are what really pop the hood on an option's behavior. They are the metrics that show you how an option’s price is expected to react to different market forces. For any serious trader, they're non-negotiable for understanding risk.
Modern platforms that show real-time Greeks have completely changed the game. It wasn't that long ago that calculating this stuff was a complex, manual chore. Now, thanks to extensive historical data from providers like OptionMetrics, we can backtest and refine strategies with a level of precision that was once unimaginable.
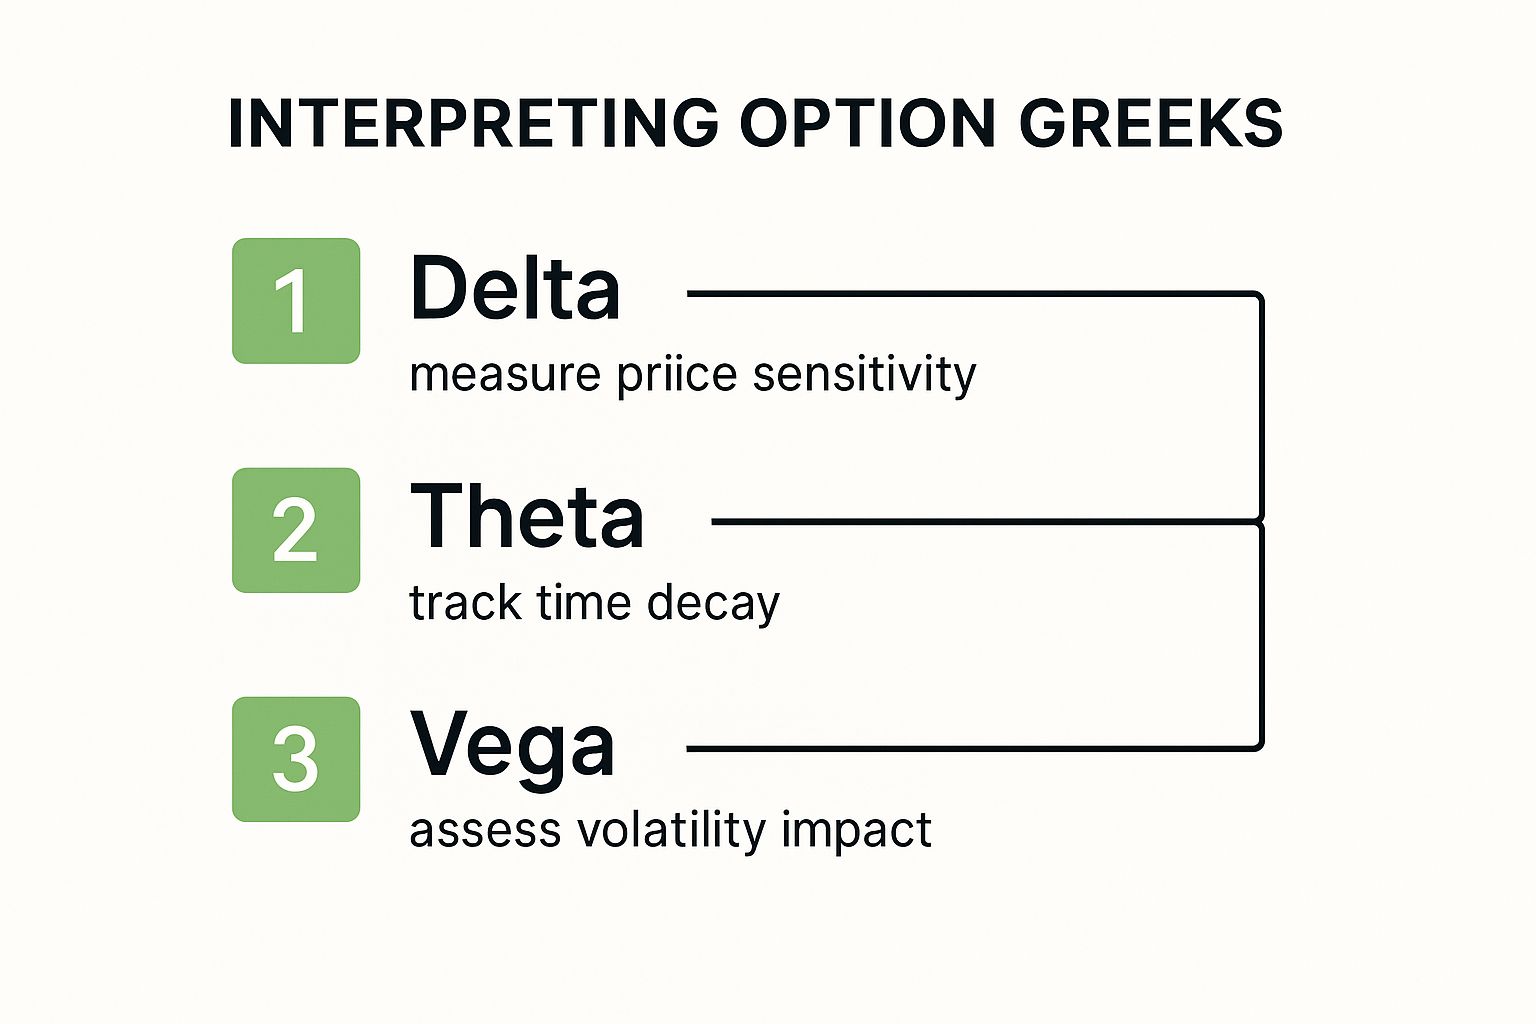
Here are the big three you need to know:
- Delta: Think of this as your option's speedometer. It tells you how much the option's price should move for every $1 change in the underlying stock. A call option with a 0.70 Delta will gain about $0.70 in value if the stock pops $1.
- Theta: This is the silent killer—time decay. Theta tells you how much value an option loses every single day just from the clock ticking closer to expiration. A Theta of -0.05 means your option is bleeding $5 per day (since one contract equals 100 shares), even if the stock price doesn't budge.
- Vega: This one measures an option's sensitivity to swings in implied volatility (IV). If Vega is 0.10, the option’s price will climb by $0.10 for every 1% jump in IV. It’s essentially how much you’re paying for the market’s fear or excitement.
For anyone selling covered calls or cash-secured puts, Theta is your best friend. Every day that passes, the option you sold gets a little cheaper, inching you closer to keeping that full premium. Time is literally on your side.
Putting It All Together in a Real Trade
Let’s say a stock is trading at $100 and you’re feeling bullish. You could grab a slightly in-the-money call option with a Delta of 0.75. This one contract essentially gives you the price exposure of owning 75 shares of the stock, but for a fraction of the capital. If you're right and the stock runs, you're in a great position.
Now, flip that around. Imagine looking at a weekly option that expires in just two days. Its Theta is going to be through the roof because its time value is evaporating at an incredible rate. For a buyer, that’s a ticking time bomb. But for a seller? That’s a prime opportunity to collect premium by capitalizing on that rapid decay.
If you want to go a layer deeper on this, we've got a whole guide that helps explain the Greeks for options in more detail.
Bringing It All Together: A Real-World Walkthrough
Theory is great, but putting it into practice is where the rubber meets the road. Let's walk through a common trading scenario to see how all these pieces of the option chain fit together.
Imagine you're bullish on NVIDIA (NVDA) leading up to their earnings report. You’ve done your research, and your thesis is simple: "I believe NVDA will rally over the next month." This simple statement is your starting point—it immediately tells you to focus on the call side of the chain.
Setting Up Your Trade
First up, you need to pick an expiration date. Your outlook is for the "next month," so you'll want to look at contracts expiring roughly 30 to 45 days from now. This is a sweet spot that gives your trade enough runway to develop while avoiding the punishingly fast time decay (Theta) that plagues shorter-term weekly options.
With an expiration cycle chosen, it’s time to scan the strike prices. For a directional bet like this, an at-the-money (ATM) or slightly out-of-the-money (OTM) call often provides a great blend of potential upside and manageable cost. Let’s say you narrow it down to a strike just a few dollars above where NVDA is currently trading.
Now for a critical checkpoint: liquidity. Before you even think about placing an order, glance at the Volume and Open Interest for your chosen strike. Are you seeing numbers in the hundreds or, even better, thousands? That's a green light. High figures here mean a healthy, active market, which translates to a tight bid-ask spread and, crucially, the ability to get out of your trade easily when the time comes.
This is a great point to pull in the option Greeks to really fine-tune your selection. The visual below gives a great sense of the workflow.

As you can see, Delta, Theta, and Vega aren't just abstract numbers; they're lenses that help you understand exactly how your trade will behave under different conditions.
To make this process even more concrete, I like to use a simple checklist. It helps ensure I don't skip a step, especially when the market is moving quickly.
Sample Option Selection Checklist
This checklist provides a structured way to move from a general trading idea to a specific contract, making sure you've considered the most important variables.
| Analysis Step | Key Question to Ask | Example Metric to Check |
|---|---|---|
| 1. Define Thesis & Direction | Am I bullish or bearish? What's my target price? | Focus on Calls (bullish) or Puts (bearish). |
| 2. Select Expiration | How much time does my trade need to work out? | Look for 30-60 DTE (Days to Expiration). |
| 3. Choose a Strike Price | How much risk am I willing to take? | Check the Delta (e.g., 0.40-0.60 for ATM). |
| 4. Verify Liquidity | Can I get in and out of this trade easily? | Open Interest > 500, Volume > 100. |
| 5. Analyze Implied Volatility | Is this option cheap or expensive right now? | Compare current IV to its historical range. |
| 6. Review the Greeks | How will this option behave? | Check Theta for time decay cost, Vega for volatility risk. |
Following a repeatable process like this is what separates disciplined trading from just gambling. It forces you to think through the mechanics of your trade before putting any capital at risk.
By methodically analyzing each of these components, you transform a general market opinion into a specific, well-reasoned trade. This structured approach is the foundation of consistent options trading.
Questions That Always Come Up
The more time you spend staring at option chains, the more you start to wonder about the why behind the numbers. Let's tackle a few of the big questions that pop up for every trader. Getting these down will make everything else click into place.
Intrinsic vs. Extrinsic Value
So, what exactly are you paying for when you buy an option? The price, or premium, isn't just one number; it's made of two distinct parts.
First, you have intrinsic value. This is the option's real, tangible value if you exercised it right this second. For a call option, it's simply the amount the stock price is above the strike price. If the stock is below the strike, the intrinsic value is zero. Easy enough.
Then there's extrinsic value. This is the squishier part of the price. Think of it as the "maybe" value—it’s the premium traders are willing to pay for the possibility of the option becoming more profitable. This value is juiced by two main things: time left until expiration and how much the stock is expected to bounce around (volatility).
As an option gets closer to its expiration date, that extrinsic value melts away in a process called time decay. It's a race against the clock.
The simplest way I've found to think about it is this: Intrinsic value is what an option is worth today. Extrinsic value is what the market thinks it could be worth in the future. Knowing the difference is crucial so you don't get caught overpaying for pure hope.
Why Is Implied Volatility Such a Big Deal?
You'll hear traders talk about implied volatility (IV) constantly, and for good reason. It’s the market’s best guess at how much a stock will move in the future, and it has a massive impact on an option's extrinsic value.
When IV is high, options get more expensive for buyers because there's a greater perceived chance of a big price swing. For sellers, however, high IV means juicier premiums. You'll almost always see IV spike right before big news, like an earnings report. That's the market collectively holding its breath, expecting fireworks.
Can the Option Chain Hint at Support and Resistance?
You bet it can. The chain is a fantastic sentiment map if you know where to look. Zero in on strike prices that have a massive amount of open interest.
When you see a giant pile of open interest on call options at a specific strike, it can act like a ceiling, or resistance level. Why? Because a ton of money is betting the stock won't push past that price. On the flip side, a huge wall of put open interest can signal a strong floor, or support level. These clusters show you where the big players have drawn their lines in the sand.
Ready to stop guessing and start using data-driven probabilities in your options trading? Strike Price provides real-time alerts and analytics to help you confidently sell covered calls and secured puts. Turn your trading into a strategic, income-generating process by visiting https://strikeprice.app to get started.