How to Calculate Dividend Yield | A Simple Guide for Investors
If a stock moves past your strike, the option can be assigned — meaning you'll have to sell (in a call) or buy (in a put). Knowing the assignment probability ahead of time is key to managing risk.
Posted by
Related reading
A Step-by-Step Covered Calls Example for Consistent Income
Unlock consistent income with our step-by-step covered calls example. This guide breaks down the strategy, risks, and outcomes to help you trade confidently.
Long Call and Short Put The Ultimate Synthetic Stock Guide
Unlock the power of the long call and short put strategy. This guide explains how synthetic long stock works, its benefits, risks, and how to execute it.
What is a Call Spread? A Clear Guide to Bull and Bear Spreads
What is a call spread? Discover how bull and bear spreads limit risk and sharpen your options trading strategy.
To figure out a stock's dividend yield, you just need a quick bit of math: divide the annual dividend per share by the current stock price. The percentage you get tells you exactly how much cash flow you're earning for every dollar invested. Simple as that.
Understanding the Dividend Yield Metric
For any income-focused investor, dividend yield is one of your most important tools. It cuts right through market hype and gives you a clear, honest measure of a stock's power to generate income right now.
Think of it as the "interest rate" you earn from owning a piece of the company, paid directly from its profits.
I lean on this metric for a few key reasons:
- It Makes Comparisons a Breeze: You can instantly size up the income potential of different stocks. All things being equal, a 4% yield is obviously a better income play than a 2% yield.
- It's a Sign of Financial Health: A company that pays a consistent, reasonable dividend is often a stable, mature business with a solid handle on its cash flow.
- It Aligns with Your Goals: This metric is crucial if you're trying to build a portfolio that generates regular passive income from stocks.
Dividend yield is a fundamental way to size up a stock’s income potential. For example, if a company pays out $2 per share annually and its stock is trading at $40, the dividend yield is a solid 5%.
Of course, the yield is just the starting point. It's one piece of the puzzle. To really get a feel for why it matters, it helps to understand the bigger picture of investment profitability, which includes knowing how to calculate return on investment (ROI).
By getting comfortable with this simple percentage, you can start making smarter decisions and quickly see if a stock truly fits your investment strategy.
Finding the Numbers for Your Calculation
Your dividend yield calculation is only as good as the numbers you feed it. Getting the right data is pretty simple once you know where to look and what, specifically, you're looking for. The two pieces of the puzzle you absolutely need are the annual dividend per share and the current stock price.
Nailing down these two figures is the first real step before you can do any kind of meaningful analysis.
Locating the Annual Dividend Per Share
The first number you need is what the company pays out to its shareholders for each share they own over an entire year. You can usually find this on major financial sites like Yahoo Finance or Bloomberg, or right inside your brokerage account's stock details. Just look for a field labeled "Forward Dividend" or "Annual Dividend."
But here's a common tripwire. Many companies, especially in the U.S., pay out their dividends quarterly. If you see a quarterly dividend listed (say, $0.50), you have to annualize it to get the right number for the formula.
It's a simple multiplication: just take the quarterly payment and multiply it by four.
- Quarterly Dividend: $0.50
- Annual Dividend Calculation: $0.50 x 4 = $2.00 per share
This step is critical. If you accidentally use the quarterly figure, you'll end up with a dividend yield that's only a quarter of the real value—leading to a completely flawed view of the stock's income potential.
This infographic breaks down the process of gathering your inputs and running the numbers.
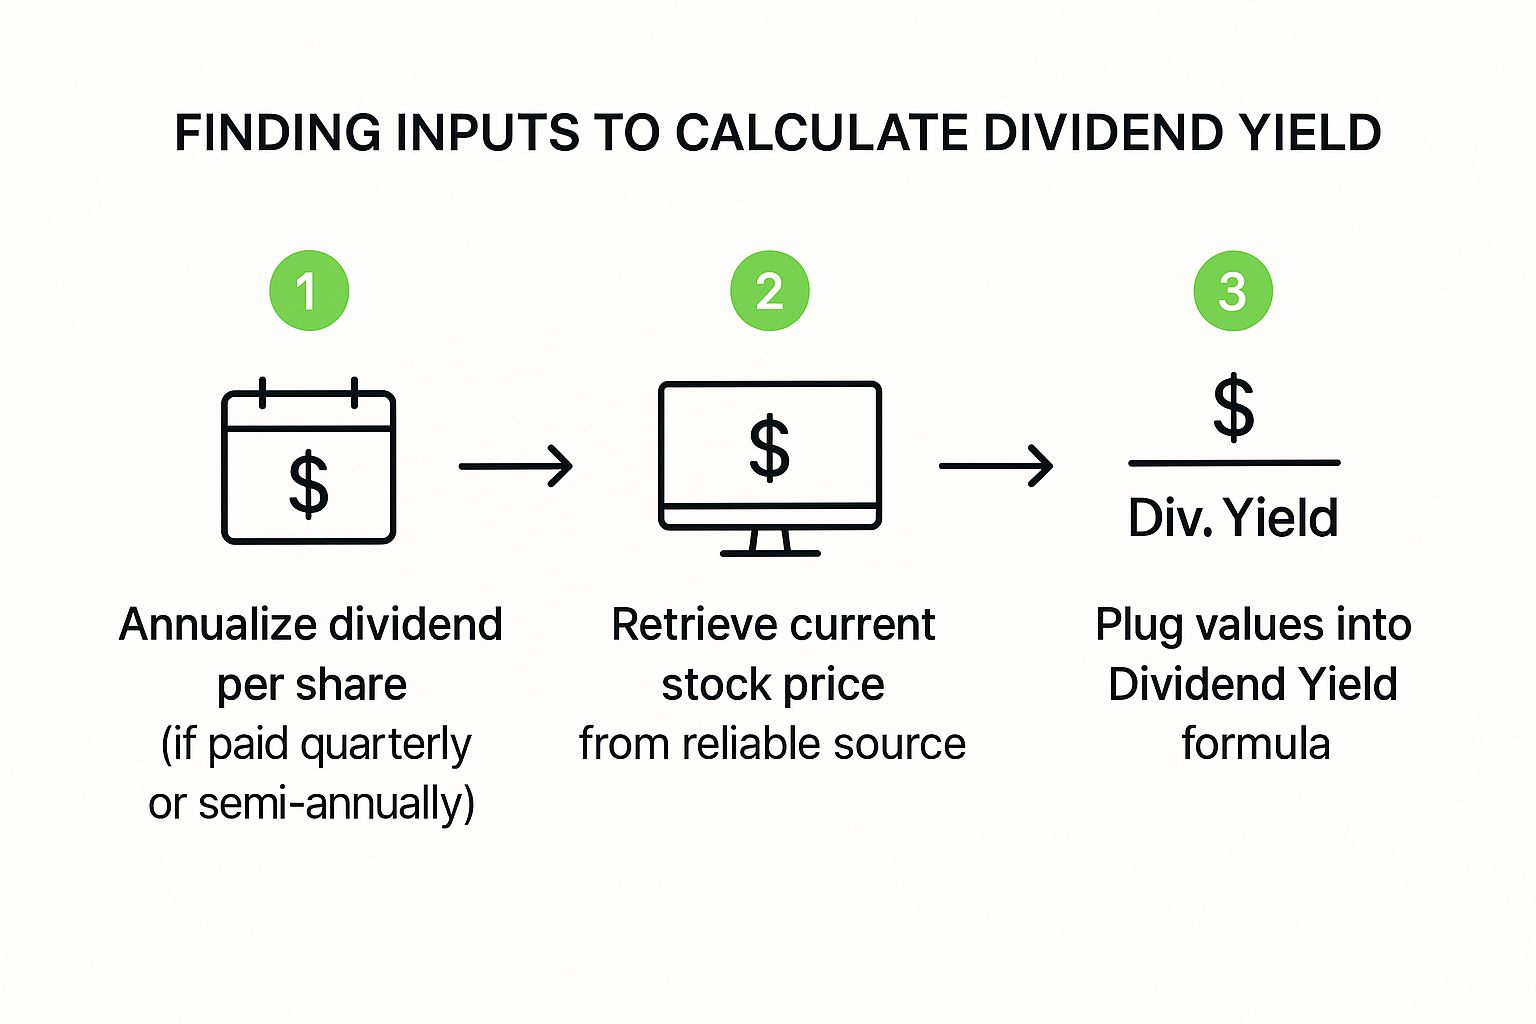
As you can see, annualizing the dividend and grabbing a real-time stock price are the two essential prerequisites to using the dividend yield formula correctly.
Finding the Current Stock Price
The second piece of the puzzle is the stock's current market price per share. This one is much easier to find; it's plastered all over any stock ticker or financial news site you pull up. That price is what it would cost you to buy one share of the company at that very moment.
Key Takeaway: Dividend yield is a moving target. Because a stock's price is constantly in flux during the trading day, its dividend yield changes right along with it. A calculation you make in the morning could be slightly different by the afternoon.
For that reason, you should always use the most current price you can get. Yesterday's closing price is fine for a ballpark estimate, but for the most accurate number, a live or near-live price from a reliable source like your brokerage platform is always best. This ensures your calculation reflects the stock's current value in the market, not where it was yesterday.
Putting the Dividend Yield Formula to Work
Theory is great, but concepts don't really click until you see them in action. Let's run the numbers on two very different kinds of companies to see how this one little metric tells a much bigger story about their business strategy.
First up, imagine a classic, stable utility company. We'll call it UtilityCorp. This is the kind of business known for steady cash flow and predictable profits—a favorite among income investors for a reason.
Let’s see what their dividend yield looks like:
- Annual Dividend: UtilityCorp pays out $2.50 per share each year.
- Current Stock Price: The stock is trading at $50.00 a share.
The math is simple: ($2.50 ÷ $50.00) x 100 = 5.0% Dividend Yield.
That 5.0% is a pretty solid yield. It tells you this company is focused on returning a good chunk of its profits directly to shareholders, providing them with a reliable income stream.
Contrasting With a Growth Company
Now, let's pivot to a fast-growing tech firm, TechGrowth Inc. This company is in a totally different phase. Instead of paying out big dividends, it’s pouring most of its cash back into the business—think research, development, and expansion—to gobble up market share.
Here’s how their numbers stack up:
- Annual Dividend: TechGrowth Inc. pays a much smaller dividend of $0.40 per share.
- Current Stock Price: Its stock is priced higher at $80.00 per share, driven by high expectations for future growth.
Plugging these into the formula, we get: ($0.40 ÷ $80.00) x 100 = 0.5% Dividend Yield.
This tiny 0.5% yield doesn't mean TechGrowth Inc. is a "bad" investment. It just signals a completely different priority. Investors buying this stock aren't looking for immediate income; they're betting on the stock price itself to climb much higher over time.
The key takeaway is that dividend yield is a snapshot of a company's philosophy on cash. Are they returning it to you now, or are they reinvesting it for a bigger payoff later?
A high yield isn't automatically better than a low one. It all comes down to your personal goals. Are you building an income portfolio for today or a growth portfolio for tomorrow?
Of course, dividend yield is just one piece of the puzzle. To get the full picture, you need to look at it alongside other metrics. For example, it’s smart to also learn how to calculate annualized return to understand a stock's total performance over time.
As you get more comfortable with these formulas, you might want to evaluate different investment calculators to see how various inputs can change your expected outcomes, whether you're looking at stocks, real estate, or other assets.
Looking Beyond the Basic Calculation
Figuring out the dividend yield is the easy part. The real skill is learning to read between the lines and understand what that number is actually telling you. A single percentage can be dangerously misleading without the right context.
This is where you graduate from simply doing the math to thinking like a seasoned investor.
Sure, the mechanics are straightforward, but you have to look deeper. For instance, there's a world of difference between a trailing yield (which looks at past payouts) and a forward yield (which is just an estimate). The past is fact, but the future is always uncertain. You can get more great insights on this from the experts at Morningstar.
One of the first things you learn to spot is the infamous "yield trap." This happens when a company's stock price takes a nosedive, which artificially pumps up the dividend yield percentage. Seeing an 8% or 10% yield might make your eyes light up, but it could be a massive red flag. That juicy number might be screaming that the business is in deep trouble and a dividend cut is right around the corner.
Pro Tip: Never, ever take a high dividend yield at face value. Always dig in and ask why it's so high. Is it because of a healthy, growing dividend, or is it because the stock price is collapsing?
Gauging Dividend Sustainability
To sidestep these traps, you need to do a little homework on the company’s dividend history and its overall financial health. A company’s track record speaks volumes.
Have they been consistently paying—or better yet, increasing—their dividends for the last 5-10 years? A long history of reliable payouts is a powerful sign of stability. It shows that management is committed to rewarding shareholders.
But history isn't everything. You also have to figure out if the dividend is sustainable today. Two key metrics will help you do just that:
- Dividend Payout Ratio: This tells you what percentage of the company's profits is being handed out as dividends. If you see a ratio that’s consistently creeping above 80%, it could mean the company is stretching itself too thin and might struggle to keep up those payments if times get tough.
- Dividend Growth Rate: This is my personal favorite. I look for companies that not only pay a dividend but also have a habit of increasing it. A steady, even modest, growth rate is a fantastic signal of a healthy, confident business.
How Dividend Yields Compare Across Markets and Time

Calculating a dividend yield for one stock is a good start, but that number doesn't tell you the whole story. A yield is only powerful when you have a wider perspective. It doesn't exist in a vacuum; it’s constantly being shaped by historical trends, economic conditions, and even national corporate culture.
For instance, a 4% yield might look pretty solid in the U.S. market. But in a market like the UK, where returning cash to shareholders is often a higher corporate priority, that same 4% could be just average. Knowing these differences helps you set realistic expectations and build a smarter, more diversified portfolio.
Shifting Yields Over Decades
Dividend yields in major markets have gone on a wild ride over the years. Back in the mid-20th century, when income was king, the S&P 500’s dividend yield frequently topped 5%.
But as investors' focus shifted from steady income to explosive growth, yields started a long, slow decline. By June 2025, they had hit a historic low of just 1.25%. If you're a data nerd, you can dig into these long-term trends on the St. Louis Fed’s economic data website.
This historical context is absolutely crucial. It proves that what we consider a "good" or "normal" yield can change dramatically from one decade to the next, pushed around by big economic forces and what investors are chasing at the moment.
Understanding these patterns helps you see when a yield is genuinely attractive versus when it’s just the new normal. It also gives you the foundation to grasp related ideas, like the risk premium meaning and how it shifts in different market environments.
Common Questions About Dividend Yield
Once you start calculating dividend yield, a few practical questions almost always pop up. Getting these sorted out helps you move from just crunching numbers to actually understanding what they mean for your investments.
What Is a Good Dividend Yield
There’s no magic number here. What's "good" really depends on your goals. That said, most experienced investors see a yield between 2% and 4% from a solid, established company as a healthy and sustainable sweet spot.
When you see yields pushing above 5%, it's time to pay closer attention. While tempting, an unusually high yield can be a red flag signaling a plunging stock price—a classic yield trap. Always compare a stock’s current yield to its own history and to others in its industry.
Can Dividend Yield Be Negative
This one trips people up, but the answer is a simple no. A company's dividend yield can never be negative.
Think about the math: both the annual dividend and the stock price are positive numbers. You can't get a negative result. If a company doesn’t pay a dividend at all, its yield is just 0%. A negative number is mathematically impossible.
The yield is in constant motion. Because the stock price is always changing while the market is open, the dividend yield fluctuates right along with it. It also makes a more significant jump when a company officially changes its dividend payment policy.
This is exactly why grabbing the most current data you can find is so crucial for an accurate calculation.
Turn your options trading guesswork into a data-driven strategy. Strike Price provides real-time probability metrics to help you find the perfect balance between premium income and safety. Find your next winning trade with Strike Price.