Backtest Options Strategies: Real-World Setup Guide & Tips
If a stock moves past your strike, the option can be assigned — meaning you'll have to sell (in a call) or buy (in a put). Knowing the assignment probability ahead of time is key to managing risk.
Posted by
Related reading
A Step-by-Step Covered Calls Example for Consistent Income
Unlock consistent income with our step-by-step covered calls example. This guide breaks down the strategy, risks, and outcomes to help you trade confidently.
Long Call and Short Put The Ultimate Synthetic Stock Guide
Unlock the power of the long call and short put strategy. This guide explains how synthetic long stock works, its benefits, risks, and how to execute it.
What is a Call Spread? A Clear Guide to Bull and Bear Spreads
What is a call spread? Discover how bull and bear spreads limit risk and sharpen your options trading strategy.
Getting Your First Options Backtest Running
Diving into options backtesting can feel like you’re about to pilot a spaceship. You see a dashboard full of cryptic buttons, toggles, and input fields, and the manual seems to be written in another language. I've been there. The secret that seasoned traders know is that you don’t need to understand every single function right away. The key is to start simple and run your first meaningful test to build a solid foundation.
Let's walk through the actual process, not the textbook theory. We’ll set up a common income strategy: selling a cash-secured put on a stock you wouldn't mind owning. This approach is a cornerstone for many options sellers, making it a perfect candidate for our first backtest options strategies experiment.
Defining Your Core Strategy
Before you even touch the backtesting software, you need a clear hypothesis. A vague idea like "I'll sell puts" isn't a strategy; it's a gamble. A real strategy has rules. For our example, let’s define a simple ruleset for selling a cash-secured put on SPY (the S&P 500 ETF):
- Entry Signal: Sell a new put option contract on the first trading day of each month.
- Contract Selection: Choose an expiration date that is roughly 30-45 days away.
- Strike Price: Select a strike price with a delta around .20 (or a 20 delta). This implies an approximately 80% probability of the option expiring out-of-the-money.
- Exit Condition: Let the option expire worthless, or close it for a small loss if it goes deep in-the-money.
This isn’t a complex strategy, and that's the point. Your first backtest should be on a simple, repeatable system. The goal here is to learn the mechanics of the backtesting platform, not to invent the world’s most profitable strategy on day one. For a deeper dive into the nuances of strategy selection, you can check out our guide on options strategy backtesting.
Configuring the Backtest Parameters
Now, let's plug this into a backtesting tool. While platforms differ, the core inputs are universal. You'll need to specify the underlying symbol (SPY), the time period for the test (e.g., January 2020 to December 2022 to capture different market conditions), and the strategy rules we just defined.
This process of simulating trades using past market data is what makes backtesting so powerful. It allows traders to evaluate historical performance by inputting variables like contract quantity, strike delta, and expiration cycles. For instance, you could run our SPY test and see detailed metrics like total profit/loss, return on capital, and the win/loss count.
This granular insight helps remove guesswork and shows how small parameter changes could have drastically altered outcomes. This capability is why so many traders rely on backtesting to refine their approach. You can explore how a popular platform uses over a decade of data to provide these valuable insights.
Once configured, hit "Run Backtest." The platform will crunch through years of historical data, simulating every trade according to your rules. The result will be a performance report, which is where the real learning begins. We’ve successfully moved from theory to a tangible, data-driven result.
Strategy Parameters That Actually Move The Needle
Getting a backtest to run is the easy part. The real challenge—and where most traders get stuck—is feeding it parameters that actually mean something. Too many traders throw random settings at the wall to see what sticks. This approach leads to confusing results and, even worse, a false sense of security in a flawed strategy. To truly backtest options strategies like a pro, you need to know which inputs drive performance and which are just noise.
The goal isn't to find some "magic" setting but to understand the why behind each choice. Why a .20 delta and not a .40? Why 45 days to expiration (DTE) instead of 15? These decisions completely change a strategy's risk and reward profile.
Strike Selection and Expiration Cycles
Let's start with the two big ones: the strike price (which we often select using delta) and the expiration cycle. These aren't isolated choices; they work together to define the core of your trade.
- Strike Delta: You can think of delta as a rough proxy for the probability of an option's strike finishing in-the-money. A short put with a .20 delta has, in theory, about a 20% chance of being tested. If you bump that up to a .35 delta, you collect more premium, but you'll also find your position challenged more often. It's a direct trade-off between income and risk. My personal sweet spot for selling premium is often between a .15 and .30 delta, as it provides a solid balance of premium collection without constant fire drills.
- Days to Expiration (DTE): This decision is all about theta, or time decay. Selling options with 30-45 DTE is popular because it captures that sweet spot where theta decay really starts to accelerate. Shorter-term options (under 21 DTE) decay faster but come with much more gamma risk, meaning prices can whip against you violently. On the other hand, longer-term options (60+ DTE) are slower and feel safer, but they tie up your capital for less premium per day.
A .20 delta put sold with 45 DTE is a completely different animal than a .20 delta put sold with 10 DTE. The first is a slow-and-steady income play; the second is a high-risk, high-gamma bet on a short-term move. Your backtest must reflect the style you actually intend to trade.
Management Rules: The Real Secret Sauce
This is what separates institutional-quality backtests from amateur ones. Your entry rules are important, but your exit and management rules are what truly determine long-term success.
To understand how different settings can impact a strategy, it's helpful to see them side-by-side. The table below compares conservative vs. aggressive settings for common management rules.
Key Strategy Parameters and Their Impact on Backtest Results
Comparison of how different parameter settings affect strategy performance across various market conditions
| Parameter | Conservative Setting | Aggressive Setting | Impact on Win Rate | Impact on Max Drawdown |
|---|---|---|---|---|
| Profit Target | 25% of Max Profit | 75% of Max Profit | Can lower it (more trades) | Can lower it (less time in market) |
| Stop-Loss | 1.5x Premium Credit | No Stop-Loss | Higher | Potentially Higher |
| Rolling Trigger | Test at 21 DTE | Let it Expire | Higher | Lower |
| Position Size | 1% of Capital | 5% of Capital | Unchanged | Significantly Higher |
As you can see, there are clear trade-offs. An aggressive profit target might seem appealing, but a conservative one gets you out of the trade faster, reducing your overall risk exposure.
Setting a profit target of 50% of the premium received is a classic management rule. It gets you out of trades early, cuts down on risk, and frees up your capital for the next opportunity. On the flip side, a strict stop-loss, like closing a trade if the loss hits 2x the premium received, can prevent a small loser from becoming a portfolio-killer. These aren't just numbers you plug in; they are fundamental risk management decisions that your backtest needs to validate. A strategy with no exit rules isn't a strategy at all—it's just a hope.
The infographic below shows how a well-defined backtest, using thoughtful parameters like these, can drastically improve key performance metrics.
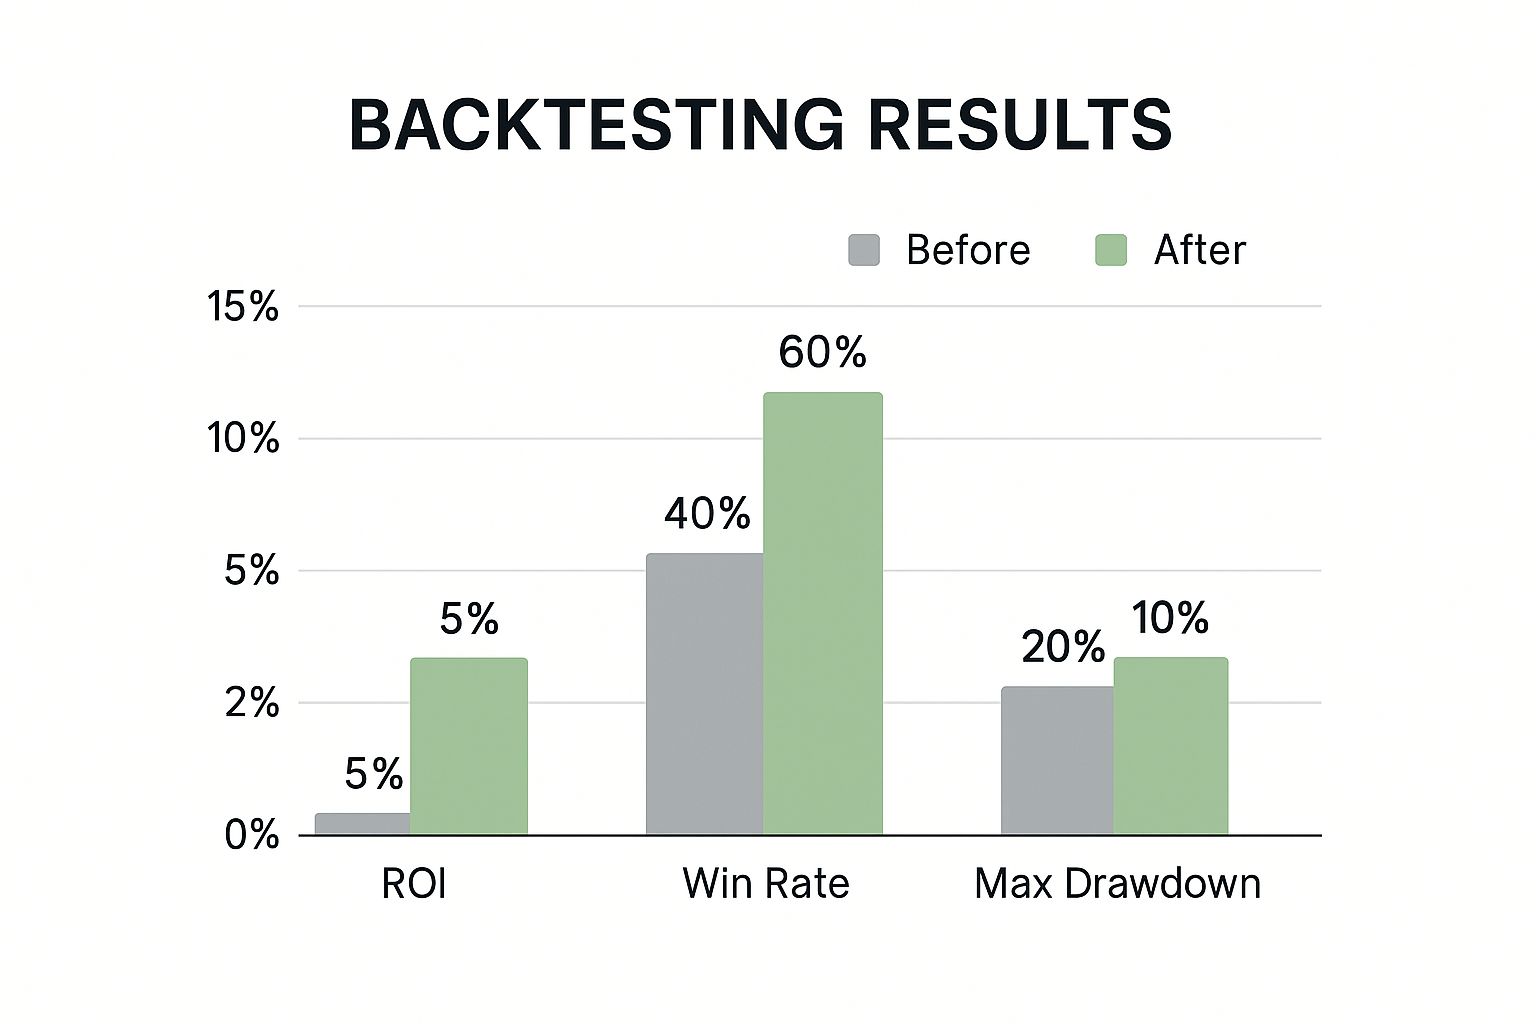
This data clearly shows that moving from guesswork to a data-driven approach dramatically cuts down on major losses while improving overall profitability and consistency.
Working With Market Data That Tells The Truth
Your backtest is only as good as the data it’s built on. I can’t stress this enough. So many traders unknowingly use flawed or incomplete datasets, which leads to a dangerous false confidence. A strategy that looks like a world-beater might just be a product of cherry-picked data. Real pros know the secret is to test a strategy across a wide variety of market cycles, not just the recent bull run that makes everything look brilliant.

This means you need to intentionally include periods of stress in your backtest. What happens to your beloved covered call strategy during a sharp bear market like March 2020? How does your iron condor perform in a choppy, sideways market like we saw for much of 2015? These are the questions that separate a robust strategy from a lucky one. When you backtest options strategies, you're not trying to prove you're right; you're trying to find out where you might be wrong.
Data Headaches That Skew Results
Beyond just picking the right time frames, you have to account for the technical gremlins in historical data that can completely invalidate your results. These are the little details that often get overlooked but have a massive impact:
- Dividend Adjustments: When a stock pays a dividend, its price drops by the dividend amount. If your data doesn't account for this, it can trigger false sell signals or make a put option appear more profitable than it really was.
- Stock Splits and Mergers: Corporate actions like stock splits can wreak havoc on a backtest if not handled properly. A 10-for-1 split makes historical prices look drastically different, and your backtest needs to understand that context.
- Early Assignment Risk: While rare for out-of-the-money options, early assignment can happen, especially around dividend dates. A good backtesting platform should at least let you model for this possibility, as it can completely change your position's dynamics.
A practical example makes this clear. An iron condor strategy backtested from 2017-2019 would likely show amazing returns. It was a period of low volatility and steady upward drift. However, if you extend that same backtest to include 2020-2022—capturing the COVID crash and subsequent recovery—the results might look terrifyingly bad. This doesn't mean the strategy is useless, but it reveals its true character and the environments where it needs careful management.
The Granularity of Modern Data
The quality of data has also taken a huge leap forward. Not long ago, testing was limited to end-of-day data, which missed all the intraday price action. Modern advancements now allow for high-resolution testing using minute-level historical data. This is a game-changer for short-term strategies like 0 Days to Expiration (0DTE) trades, where intraday swings are everything.
This granular data lets you set precise entry and exit filters, see trade-by-trade performance, and even combine results to simulate portfolio-level effects. Some platforms even allow you to instantly convert a successful backtest into a live trading bot. This integration of testing and automation is a powerful evolution for data-driven traders. To get a feel for these capabilities, you can explore the possibilities with high-resolution options backtesting.
Reading Performance Metrics Like A Professional
After running a backtest, the platform presents a screen full of numbers. While the total profit and loss figure is what everyone’s eyes jump to first, it barely scratches the surface. To truly backtest options strategies effectively, you need to dissect the performance metrics like a professional. This means looking beyond the obvious to understand if your strategy is robust or just a ticking time bomb.
A high win rate, for example, is often misleading. I've seen strategies with a 90% win rate that look incredible on paper but are actually extremely dangerous. These strategies often involve collecting tiny premiums while taking on huge, undefined risk. They win small, win small, win small... and then one catastrophic loss wipes out all the gains and then some. A lower win rate with well-managed losses is almost always superior.
Metrics That Reveal the Real Story
To get a true picture of performance, you need to focus on risk-adjusted returns and drawdown patterns. These metrics tell you not just how much you made, but how you made it and what kind of pain you had to endure along the way.
Here are the key metrics I always analyze:
- Maximum Drawdown: This is the peak-to-trough decline your account experienced during the backtest. It’s the single most important number for gauging the emotional pain a strategy will inflict. If your backtest shows a 35% drawdown, ask yourself honestly: could you stick with the strategy while your account is down by a third? For most people, the answer is no.
- Sharpe Ratio: This metric measures your return per unit of risk, which is usually volatility. A higher Sharpe Ratio (generally above 1) suggests a better risk-adjusted return. It helps you compare different strategies on an apples-to-apples basis.
- Calmar Ratio: This is another risk-adjusted measure, but it specifically uses the maximum drawdown as its risk metric. I personally find it more intuitive than the Sharpe Ratio for options selling strategies, as it directly answers the question: "How much return am I getting for the worst-case loss I had to sit through?" A Calmar Ratio above 2.0 is considered quite strong.
To help you get comfortable with these figures, here is a quick guide to some of the most important metrics you'll find in a backtest report.
| Metric | Calculation | Good Range | Warning Signs | Why It Matters |
|---|---|---|---|---|
| Maximum Drawdown | (Peak Value - Trough Value) / Peak Value | < 20% | > 30% | Measures the largest single drop from a portfolio peak. It's a key indicator of the emotional stress a strategy will cause. |
| Sharpe Ratio | (Return - Risk-Free Rate) / Standard Deviation | > 1.0 | < 0.5 | Indicates return per unit of risk (volatility). Higher is better, showing you're being rewarded for the risk you take. |
| Calmar Ratio | Annualized Return / Maximum Drawdown | > 2.0 | < 1.0 | Measures return relative to the worst drawdown. It's excellent for seeing if the returns justify the potential pain. |
| Win Rate | (Number of Winning Trades / Total Trades) * 100 | Varies | > 90% without context | Shows the percentage of profitable trades. Can be misleading; a high win rate with large losses is a major red flag. |
| Profit Factor | Gross Profits / Gross Losses | > 1.75 | < 1.2 | A simple ratio of total money gained versus total money lost. A value below 1 means the strategy is a net loser. |
These metrics provide a much clearer picture of a strategy's real-world viability. A strategy with a lower drawdown and a solid Calmar Ratio is often far more sustainable than one with a sky-high win rate but a terrifying potential loss.
The Science Behind the Numbers
This rigorous performance evaluation is what separates amateur guesswork from professional analysis. Traders using advanced backtesting methods combine historical data with powerful statistical libraries to calculate these key metrics. They might simulate an iron condor across various market cycles, assessing how different strike widths or management rules impact performance, not just total profit. This deep dive into quantitative measures is critical for building a strategy that can withstand real market pressures. You can discover more about the technical process of options performance evaluation to see how these concepts are applied.
To truly read performance metrics like a professional, understanding fundamental concepts like statistical significance and confidence intervals is essential. It helps you determine if your results are a genuine edge or just random luck from a small sample size. A backtest with only 20 trades might look great, but the results could easily be a fluke. A backtest with over 200 trades gives you a much more reliable picture of long-term expectancy. Always look at the number of trades in your backtest—more is almost always better for statistical confidence.
Backtesting Traps That Destroy Live Trading Results
A beautifully crafted backtest report can be one of the most dangerously seductive things in trading. It shows a smooth equity curve climbing steadily upwards, promising consistent profits. But even experienced traders fall for subtle traps that make a strategy look invincible in simulation, only to have it blow up spectacularly in a live account. The most devastating mistakes aren't obvious; they're the hidden biases that create a completely distorted picture of reality.
Understanding these pitfalls is just as crucial as building the strategy itself. It’s a core component of proper options trading risk management, ensuring you don’t walk into a live market with a false sense of security.
Overfitting and Curve-Fitting
This is the cardinal sin of backtesting. Overfitting happens when you tweak your strategy parameters to perfectly match the historical data you’re testing on. Maybe you discover that an iron condor on QQQ performed best if you only entered on Tuesdays when the VIX was exactly 17.4, and you took profits at 48%. The results look amazing, but you haven’t discovered a market edge—you’ve just curve-fitted your rules to past noise.
A strategy that is over-optimized is brittle. It’s designed for a past that will never repeat itself exactly. The moment it encounters new market conditions, it shatters. A good rule of thumb: if your strategy has more than a handful of very specific rules, you might be overfitting.
The Bias Blind Spots
Several cognitive and data-related biases can sneak into your process, making your backtest results dangerously unreliable. Recognizing them is the first step to avoiding them.
- Look-Ahead Bias: This is when your backtest model uses information that wouldn't have been available at the time of the trade. For example, using the closing price of a day to decide to enter a trade during that same day. You couldn’t have known the closing price ahead of time. A quality backtesting platform is built to prevent this, but it can still creep in with custom-coded strategies.
- Survivorship Bias: This trap occurs when your historical data only includes stocks or funds that "survived" over the test period. It ignores all the companies that went bankrupt or were delisted. If you backtest a strategy on the current S&P 500 components over the last 20 years, your results will be artificially inflated because you've excluded all the losers that were dropped from the index along the way.
- Confirmation Bias: This is a psychological trap where you unconsciously look for results that confirm your existing beliefs about a strategy. You might stop testing after finding a profitable period, ignoring other times when the strategy failed miserably. You see what you want to see, which is a recipe for disaster.
The image below shows how a backtest, when plotted against actual market events, can sometimes appear disconnected from the real-world volatility and risks faced by traders.

This highlights why it's critical to ensure your backtest isn't just a sterile simulation but a true test against varied and stressful market conditions. Forgetting to include transaction costs like commissions and slippage is another common oversight. A strategy that generates hundreds of trades might look profitable, but once you factor in even $1 per contract in costs, the profits can vanish entirely. Always configure your backtester to include realistic costs to get a true measure of performance.
Advanced Testing Techniques That Actually Work
Once you've nailed the basics and know the common traps to avoid, it's time to start testing your strategies like an institution. Professionals don't just run a simple historical backtest and assume it's good to go. They use tougher methods to see how a strategy might actually perform in the future, not just how it did in a perfect past. These techniques are what you need to truly backtest options strategies for strength.
One of the best methods is walk-forward analysis. A normal backtest uses all your historical data at once, which can lead to overfitting. Walk-forward testing is smarter; it breaks the data into pieces. It will optimize a strategy on one period (say, two years of data) and then test it "out-of-sample" on the next period (like the following six months) with the parameters it just found.
The process then repeats, or "walks forward" through time. This is a brilliant way to simulate how you’d trade in the real world—periodically re-evaluating and tweaking your strategy based on what the market is doing right now.
Stress-Testing for Real-World Conditions
Beyond walk-forward analysis, you need to know if your strategy can take a punch. This is where Monte Carlo simulations are invaluable. Instead of just replaying history exactly as it happened, a Monte Carlo simulation creates thousands of possible futures by injecting randomness based on historical volatility and returns.
It might show that while your strategy did fine in the past, there's a 15% chance it could suffer a 50% drawdown during a "black swan" event that hasn't happened yet. This gives you a probabilistic look at risk, which is much more useful than a single, perfect historical performance line.
Another key technique is portfolio-level backtesting. So many traders test their strategies in a vacuum. They might have a great iron condor strategy and a solid covered call strategy, but they never test them running at the same time. This is a massive blind spot because it ignores how strategies interact. What happens when both come under pressure during a market crash? Portfolio testing shows these hidden correlation risks, helping you build a group of strategies that don't all fail at once.
Diving Deeper into Advanced Validation
To really feel confident in your results, pros use a few more advanced methods that can tell you if your performance is skill or just luck.
- Bootstrapping: This technique involves resampling your own trade history with replacement, creating many new "shuffled" equity curves. It helps you see if your amazing backtest result was just because of a few lucky home-run trades. If the bootstrapped results are consistently positive, your edge is probably real.
- Volatility Regime Testing: Don't just test across a timeline; test across different volatility environments. Isolate all the times the VIX was above 30 and run your backtest only on that data. Then, do the same for when the VIX was below 15. This quickly shows you where your strategy shines and where it falls apart.
- Incorporating Microstructure: If you're a very active trader, it's critical to model real-world trading friction like the bid-ask spread and slippage. A strategy might look fantastic using the midpoint price, but if it requires you to cross a wide spread over and over, your actual results will be much worse.
By using these advanced techniques, you go way beyond a simple historical look-back. You start asking the important questions: Is my strategy robust? Can it handle randomness? How does it react in a crisis? Getting answers to these is the final, essential step before you put your hard-earned money on the line.
Translating Backtest Success Into Live Trading Wins
The ultimate test of any backtesting effort happens when real money is on the line. A stellar performance report is one thing; executing that same strategy under the pressures of a live market is another beast entirely. This final, crucial phase is where many promising strategies fall apart—not because the backtest was wrong, but because the trader failed to manage the transition from simulation to reality.
This bridge between historical data and future profits is built on deliberate, careful action. It's not about blindly trusting your backtest and going all-in. It’s about respecting the inherent uncertainty of the market and taking measured steps to validate your findings.
From Paper to Production: The Intermediate Steps
Before you even think about committing significant capital, there's a vital intermediate phase: paper trading. Think of it as a full dress rehearsal for your strategy. You'll follow your system's rules in real-time, placing trades in a simulated account without risking a single dollar. This step is priceless for a couple of reasons:
- It forces you to stick to your system in a live, moving market, but without the emotional rollercoaster of financial loss.
- It exposes practical roadblocks. Maybe you find out that getting filled at your ideal price is way harder than the backtest suggested, or that managing the trades demands more screen time than you originally planned.
Once you’ve paper-traded successfully for a few weeks or even months and the results are lining up with what your backtest predicted, you can think about going live. But don't jump into the deep end. If your backtest was based on trading 10 contracts, start your live trading with just one. Your goal here isn't to get rich quick; it's to get comfortable trading the system with actual money and build genuine confidence in your approach. Scaling up only comes after you've proven you can execute flawlessly on a small scale. To see how a well-tested approach can lead to outstanding results, check out this real-world successful option strategy that shows the potential of disciplined execution.
Monitoring Performance and The Psychology of Live Trading
As you start trading live, your most important tool becomes your trading journal. Keeping a meticulous log is non-negotiable. This is where you'll document every trade—the entry, the exit, your reasoning, and even how you were feeling at the time. This journal becomes your own personal dataset, letting you compare your live results directly against your backtest metrics. For a comprehensive guide on what to track, you might find our article on keeping an options trading journal incredibly helpful.
It's completely normal for live performance to drift from the backtest. No two market periods are ever identical. The real test is to avoid hitting the panic button during normal ups and downs. Your backtest showed you the strategy's maximum drawdown, so don't be shocked when a drawdown actually happens. This is where psychology takes over. The emotional weight of watching a real P&L swing is something a backtest can never replicate. Sticking to your plan when you're in a drawdown is the hardest—and most important—part of systematic trading.
So, when do you step in? You should only think about pausing a strategy if its performance veers wildly from your backtested expectations over a statistically significant number of trades. A few losses are just market noise; a consistent pattern of underperformance is a signal that something fundamental might have changed, or that your initial backtest had a flaw.
Ultimately, backtesting gives you a map, but you still have to drive the car. By transitioning carefully through paper trading, starting small, maintaining a detailed journal, and managing your own psychology, you give your well-tested strategy the best possible chance to succeed where it counts: in your live account.
Ready to turn your backtesting insights into real-world income? Strike Price provides the real-time data and alerts you need to execute your covered call and secured put strategies with confidence. Start making data-driven decisions today.