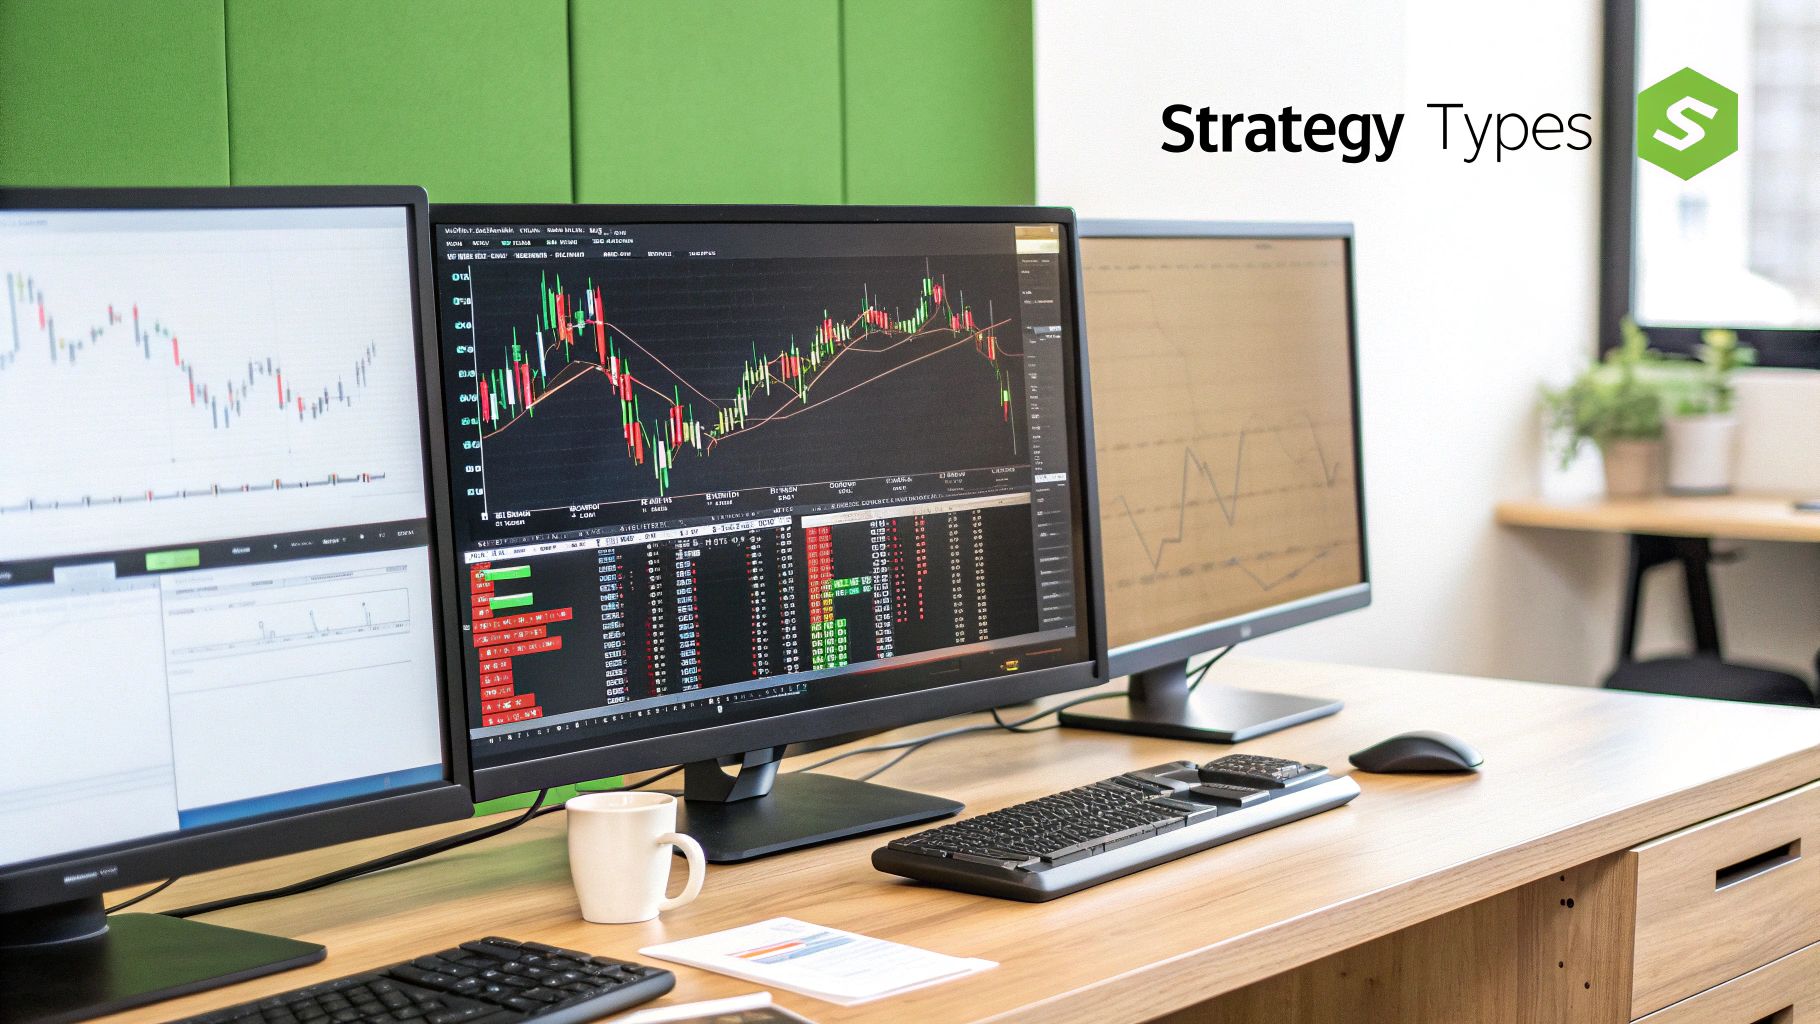
Master Volatility Trading Strategies for Market Success
If a stock moves past your strike, the option can be assigned — meaning you'll have to sell (in a call) or buy (in a put). Knowing the assignment probability ahead of time is key to managing risk.
Posted by
Related reading
A Step-by-Step Covered Calls Example for Consistent Income
Unlock consistent income with our step-by-step covered calls example. This guide breaks down the strategy, risks, and outcomes to help you trade confidently.
Long Call and Short Put The Ultimate Synthetic Stock Guide
Unlock the power of the long call and short put strategy. This guide explains how synthetic long stock works, its benefits, risks, and how to execute it.
What is a Call Spread? A Clear Guide to Bull and Bear Spreads
What is a call spread? Discover how bull and bear spreads limit risk and sharpen your options trading strategy.
Most investors see volatility as the enemy. It's that chaotic, unpredictable force that throws a wrench in the best-laid plans.
But what if you could flip that idea on its head? What if you could see those wild price swings not as a threat, but as an opportunity?
Think of a sailor who doesn't fear strong winds but instead knows how to harness them to get where they're going faster. That's the mindset behind volatility trading. It's a completely different way of looking at the market—one that stops trying to guess if a stock will go up or down and instead focuses on how much it’s likely to move.
Turning Market Swings into Your Edge
This guide is your practical roadmap into the world of volatility trading. We're going to break down how these strategies work, why they belong in a trader's toolkit, and how to put them to use with real-world data. Forget the dense, academic theory. This is about making complex ideas simple and actionable.
What You'll Learn in This Guide
We'll build your understanding from the ground up, focusing on what you actually need to know:
- The Core Idea: We'll nail down the key terms, especially the critical difference between historical volatility (what already happened) and implied volatility (what the market thinks will happen next).
- The Key Plays: You'll get to know the mechanics behind foundational strategies like Straddles, Strangles, and Iron Condors. No fluff, just how they work.
- Putting It to Work: We’ll go beyond definitions and show you when to consider these strategies, using real data to drive your decisions.
The whole point is to turn volatility from something you fear into a measurable edge. Once you learn to read the market's expectations, you can position yourself to profit whether a stock soars, dives, or even goes nowhere at all.
This isn't just theory. A study analyzing strategies across 20 highly liquid companies—think names like Netflix, Bank of America, and ExxonMobil—found real-world success by targeting price swings during major market events. You can dig into the findings from the research on volatility metrics to see how it plays out.
Decoding the Language of Market Volatility
Before you can trade volatility, you have to learn to speak its language. It really boils down to two core concepts that act like a weather report for a stock. Getting this distinction right is the first step to spotting real opportunities.
Think of Historical Volatility (HV) as a detailed logbook of past storms. It’s a backward-looking metric that tells you exactly how much a stock's price actually bounced around over a set period, like the last 30 days. HV is a fact—it shows you how choppy the waters have been.
On the other hand, Implied Volatility (IV) is the weather forecast. It’s the market’s best guess on how much the price will swing in the future. Because it’s baked into options prices, a high IV means traders are bracing for a big move. A low IV suggests they expect things to stay calm. For us, the magic often happens in the gap between the logbook and the forecast.
Introducing the Key Players: The Options Greeks
To trade volatility well, you need to know how your positions will react when the market changes. That’s where the "Greeks" come in. There are a few, but for volatility trading, two are absolutely essential.
- Vega: This is your storm meter. Vega measures how sensitive an option's price is to a change in implied volatility. It tells you how much your option’s price will move for every 1% jump or drop in IV. If you're buying options (like in a straddle), you want IV to spike, making Vega your best friend.
- Theta: This is the thief in the night, better known as time decay. Theta shows you how much value an option loses every single day as it gets closer to expiring. It’s a constant, relentless force that works against option buyers and for option sellers.
A huge part of volatility trading is just managing the tug-of-war between Vega and Theta. You're often making a bet that a potential spike in volatility (Vega) will be big enough to overpower the steady bleed from time decay (Theta).
Why Implied Volatility Is Your Focus
While historical volatility gives you important context, Implied Volatility (IV) is where the action is. IV directly pumps up or deflates option premiums. The higher the IV, the pricier the options, because the market is pricing in a greater chance of a big, profitable move.
That’s why knowing how to read and interpret IV is so crucial. Your job is to figure out if the market's forecast is too dramatic or too timid compared to what’s actually likely to happen. If you want to go deeper, you can learn more about how to calculate implied volatility and what it’s really telling you. This knowledge is the bedrock of every strategy we’re about to cover.
Profiting From Explosive Moves With Straddles and Strangles
Some of the best opportunities in the market pop up when you're sure a stock is about to make a huge move, but you have no clue which way it's headed. Think about a big earnings announcement, a pending court ruling, or an FDA decision. These are classic events where you're not betting on "up" or "down," but on "a lot."
This is where volatility trading shines. The two go-to strategies for this are the Long Straddle and the Long Strangle. Both are designed to profit from a sharp, explosive price swing, no matter the direction.
The Long Straddle: Betting on a Sharp Move
Imagine a tech company, "Innovate Corp," is about to drop its quarterly earnings report after the bell. The analysts are split—some are calling for a massive beat, others a painful miss. The only thing everyone agrees on is that the stock, currently trading at $100, is going somewhere. Fast.
This is the perfect setup for a Long Straddle. To put one on, you would:
- Buy a Call Option: You’d purchase a call option right at the current price, with a $100 strike.
- Buy a Put Option: At the exact same time, you’d buy a put option with the same $100 strike price and expiration date.
Now you own both sides of the trade. If Innovate Corp’s stock blasts off to $120, your call option becomes wildly profitable, easily covering the cost of the now-worthless put. If the stock craters to $80, your put option pays off big, covering the cost of the call. The only way you lose is if the stock just sits there, letting both options slowly lose value to time decay.
The key to pricing these strategies lies in the tug-of-war between what has happened (historical volatility) and what the market expects to happen (implied volatility).
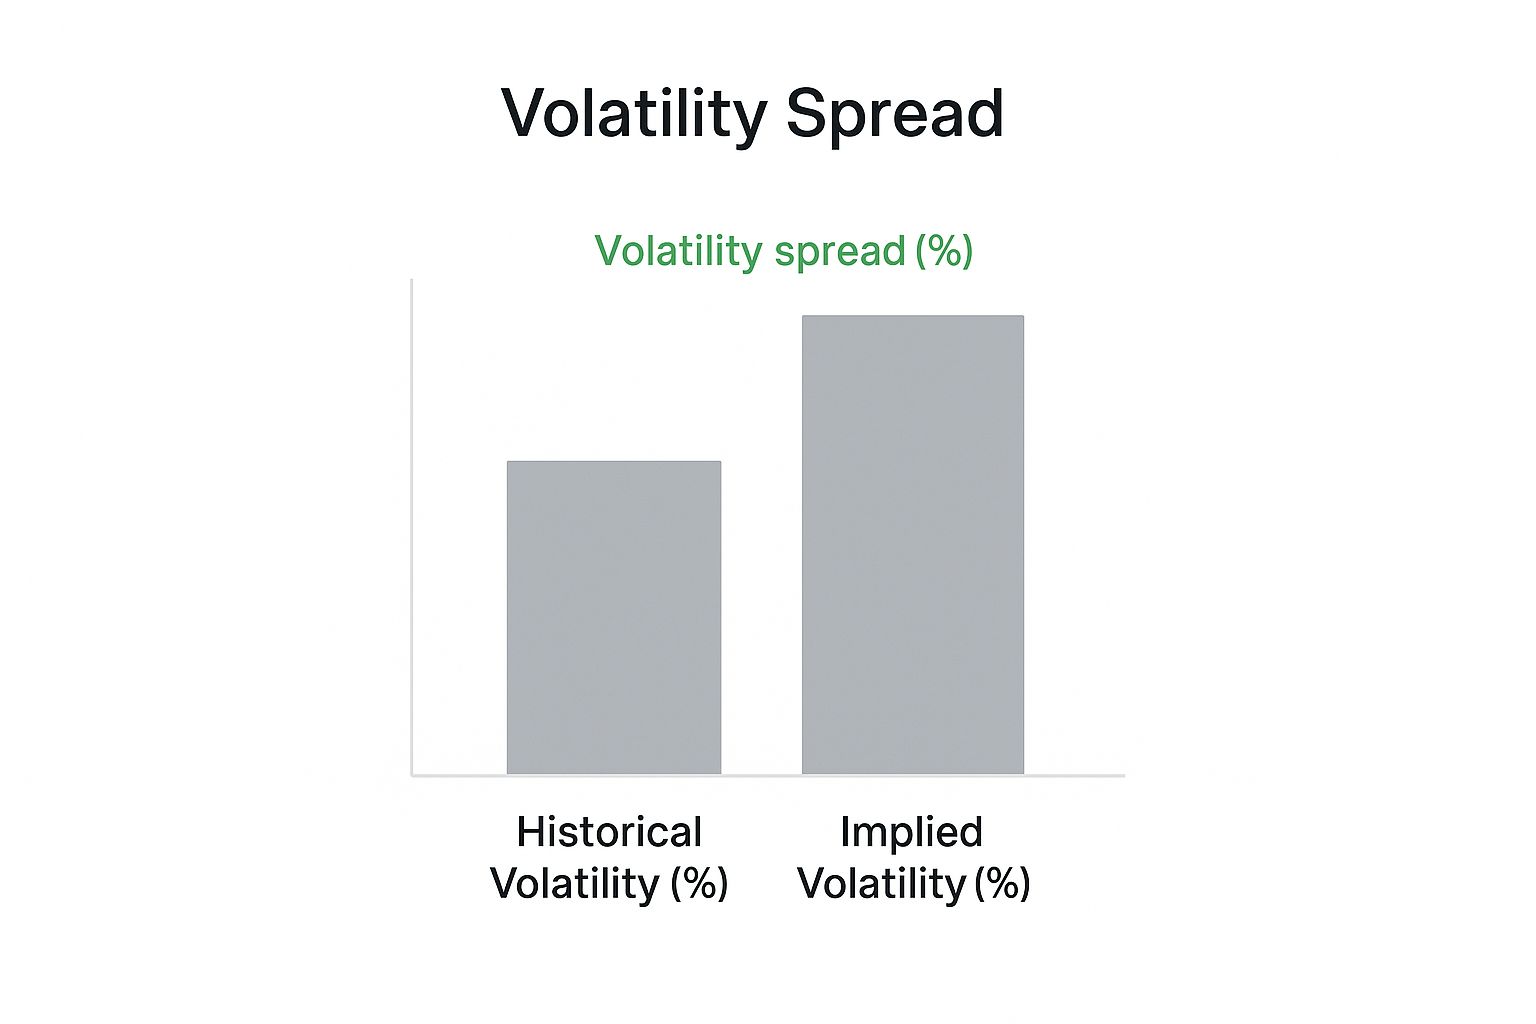
This "volatility spread" is exactly what traders look at to figure out if options are cheap or expensive relative to the stock's actual past behavior.
The Long Strangle: A Lower-Cost Alternative
A Long Strangle is the straddle's slightly more conservative cousin. It works on the same principle—betting on a big move—but it gives you a wider runway at a lower upfront cost.
Instead of buying your options at the current stock price, you buy them out-of-the-money. Using our Innovate Corp example again:
- Buy an Out-of-the-Money Call: You might buy a call with a $105 strike price.
- Buy an Out-of-the-Money Put: At the same time, you'd buy a put with a $95 strike price.
Because both options are further away from the current stock price, their premiums are a lot cheaper than a straddle's. This is great because it lowers your maximum potential loss if the stock ends up going nowhere.
But there's a trade-off for that lower cost. The stock has to make an even bigger move—past $105 or below $95—just for you to break even. It's still a bet on a large move, just one with a bit more breathing room built in.
Long Straddle vs Long Strangle At a Glance
So, when do you choose one over the other? It really comes down to cost versus the size of the move you expect. This table breaks down the core differences.
| Feature | Long Straddle | Long Strangle |
|---|---|---|
| Setup | Buy at-the-money Call & Put | Buy out-of-the-money Call & Put |
| Cost | Higher initial premium | Lower initial premium |
| Profit Trigger | Requires a moderate price move | Requires a larger price move |
| Risk | Maximum loss is the premium paid | Maximum loss is the premium paid |
| Best For | Events with expected sharp, immediate moves | Capturing larger, but less certain, price swings |
Ultimately, the straddle is for when you expect a violent, immediate reaction, and you're willing to pay for it. The strangle is for when you anticipate a big swing but want to lower your entry cost, knowing you'll need the stock to travel a bit further to get into the money.
Generating Income in Calm Markets with the Iron Condor
Not all volatility trading is about chasing chaos. While strategies like straddles and strangles are built for explosive market moves, some of the best income methods work when things are quiet, predictable, and frankly, a little boring. This is where you profit from the lack of a big move, not from one.
For this exact environment, the go-to strategy is the Iron Condor. It might sound complicated, but it’s a powerful and logical tool for any trader who thinks a stock will stay pinned within a certain price range.
Building Your Profit Zone
Think of an Iron Condor as building a "house" around a stock's price. You set the floor and the ceiling. As long as the stock price stays inside, you collect rent. That "rent" is the premium you get paid the moment you open the trade.
At its heart, an Iron Condor is just two credit spreads stacked together:
- A Bear Call Spread (The Ceiling): You sell a call option at a strike price you believe the stock will stay below, then buy another call at an even higher strike for protection.
- A Bull Put Spread (The Floor): You sell a put option at a strike price you believe the stock will stay above, then buy another put at an even lower strike for protection.
Combine these two, and you’ve created a defined profit zone. Your goal is simple: for the stock price to hang out between the two short strikes you sold. If it does that by expiration, all four options expire worthless, and you keep 100% of the premium you collected. That's your maximum profit.
Making Time Decay Your Ally
In long volatility trades, time decay—or Theta—is your enemy, constantly eating away at your option's value. With an Iron Condor, the roles are completely flipped. Here, Theta is your best friend.
Every single day that passes without the stock making a big move, the options you sold lose a little bit of value. This decay is exactly what generates your profit. You're literally getting paid to wait for the clock to run out.
This is a totally different game than income strategies like covered calls, where you're fundamentally bullish on the stock itself. If you’re curious about that approach, you can learn more about when to sell covered calls in our guide. An Iron Condor, on the other hand, is a purely neutral play on a stock going nowhere fast.
The Power of Defined Risk
Perhaps the best part of the Iron Condor is that your risk is defined from the start. Because you bought those protective "wings" (the long call and long put), your maximum possible loss is capped the second you enter the trade. You know the exact worst-case scenario before you put a single dollar on the line.
This structure gives you peace of mind and makes it a much more manageable strategy, even if you’re new to selling options. Your max loss is simply the difference between the strike prices in one of the spreads, minus the premium you collected. No surprise unlimited losses if the market suddenly goes haywire.
For traders aiming to build a consistent income stream, the Iron Condor is one of the most popular and logical volatility trading strategies out there for calm, range-bound markets.
Knowing what volatility strategies are is one thing. Knowing when to use them is where the real edge is. Timing your entry isn't about gut feelings; it’s about having a disciplined, data-driven way to see if the market's fear gauge is a bargain or a bubble.
One of the best tools for the job is the Volatility Cone. Think of it as a historical price chart, but for volatility itself. It maps the current implied volatility (IV) of a stock against its own history—showing you the highest, lowest, and average levels over different timeframes.
This gives you an instant visual check: Is today's volatility cheap or expensive compared to how this stock usually behaves? Since volatility tends to drift back toward its average over time, these cones are perfect for spotting when a spike might cool off or when a quiet period might be about to explode. You can learn more about the statistical basis of volatility cones on m-x.ca.
Here’s what a typical volatility cone looks like in action.
The chart tells a simple story. That red dot is the current implied volatility. Is it near the top of the cone (expensive) or near the bottom (cheap)? This helps you decide if it's a good time to buy or sell volatility.
Add a Trend Filter for an Extra Layer of Confidence
The volatility cone tells you if volatility is statistically cheap or expensive. But a simple trend filter can confirm if you’re stepping into the right environment for a big move. It adds context, making sure you aren't just buying cheap volatility in a market that's likely to stay sleepy.
One of the most trusted trend filters is the 200-day simple moving average (SMA). This long-term indicator is like a clear line in the sand between a bullish and bearish market.
A stock trading below its 200-day SMA is usually in a confirmed downtrend. This is an environment where fear is high and big price swings are common. On the flip side, a stock above its 200-day SMA is typically in an uptrend, which tends to be a calmer, less volatile environment.
Putting these two tools together gives you a powerful framework for timing your trades:
- Going Long Volatility (e.g., Straddles): Look for stocks trading below their 200-day SMA where the volatility cone shows IV is historically cheap. This signals a potential bargain on volatility in an already shaky environment—a great setup for a long straddle.
- Going Short Volatility (e.g., Iron Condors): Look for stocks trading above their 200-day SMA where the volatility cone shows IV is historically expensive. Here, you can sell overpriced options in a stable market and let time decay do the heavy lifting for you.
This disciplined combo helps you get past the guesswork. It's about making strategic entries based on solid evidence, not just a hunch.
Mastering Risk Management in Volatility Trading

Here’s the thing about trading: winning isn’t about being right every time. It's about making sure your mistakes don't take you out of the game for good. This is especially true when you're trading volatility, where the constant pressure of time decay and the threat of sudden price spikes demand an iron-clad approach to risk.
If you’re long volatility with a straddle, you’re in a constant fight against Theta, or time decay. Every single day that ticks by without a big price move is silently eating away at your option’s value. On the flip side, if you're short volatility with something like an Iron Condor, you’re exposed to sudden, violent price swings that can blow right through your profit zone and trigger rapid losses.
The entire game of volatility trading is built on a foundation of sound risk management. Without it, even the most brilliant strategy is doomed to fail. Your ability to protect your capital is what will keep you in this business.
Core Risk Management Techniques
To handle these unique risks, you need a non-negotiable risk framework. This isn't just a friendly suggestion; it's a hard requirement if you want to perform consistently. The most profitable volatility trading strategies are always chained to strict, unwavering rules.
- Smart Position Sizing: Never, ever risk more than a small slice of your portfolio on a single trade. The pros stick to 1-2%. This ensures that one bad trade doesn't cripple your entire account.
- Setting Profit Targets: Know exactly where you’re getting out before you even get in. Decide on a realistic profit goal and stick to it. This stops greed from turning a solid win into a painful loss.
- Implementing Stop-Losses: A stop-loss is your ultimate safety net. It’s a pre-set price or loss percentage where you exit the trade, no questions asked. It's your emergency brake to cap the downside.
For a deeper dive into protecting your capital, check out our essential guide on options trading risk management.
A Backtested Example of Disciplined Trading
Don't just take my word for it—the proof is in the data. One backtested strategy on the S&P 500 only entered trades when the index closed below its 200-day moving average, a classic signal of a high-volatility environment.
The results? This disciplined approach generated an annualized return of 5.6%, even though it was only invested in the market 4.6% of the time. You can dig into how these systematic volatility approaches performed on QuantifiedStrategies.com.
This drives home a critical point: consistent profits don't come from hitting home runs. They come from applying a well-defined system with rigorous risk controls, day in and day out.
Got Questions? Let's Clear Things Up.
As you start digging into volatility trading, a few questions always seem to pop up. Getting them answered is the key to building the confidence you need to actually put these strategies to work in the real world.
Let's tackle some of the most common ones head-on.
What's the Best Market for Volatility Trading?
This is a classic question, but there's no single answer. The "best" market is the one that lines up perfectly with the strategy you’ve chosen. It's all about matching your trade to what you expect the market to do next.
If you're expecting fireworks—a huge price move in either direction—then long volatility strategies like straddles and strangles are your go-to. Think about the days leading up to a big earnings report or an economic announcement. The direction is a toss-up, but you know something is about to happen.
On the flip side, if you're predicting a calm, boring market that's likely to trade sideways, short volatility strategies like the Iron Condor shine. In these low-key environments, you’re looking to collect premium as time ticks away and options peacefully expire.
Are These Strategies Really for Beginners?
While anyone can learn them, these aren't "set it and forget it" trades. You absolutely need a solid handle on the basics—things like strike prices, expiration dates, and what implied volatility actually means. These strategies require you to pay attention.
For anyone new to this world, paper trading is non-negotiable. It’s the only way to see how these trades react to live market swings without putting a single dollar on the line. You'll get a real feel for their unique profit and loss dynamics, risk-free.
If you are just starting out, stick with risk-defined strategies like an Iron Condor. It’s a much safer entry point than jumping into trades with potentially unlimited risk.
How Do I Know If Volatility Is High or Low?
Great question. Traders don't just guess; they use specific tools to see if volatility is cheap or expensive right now. For a big-picture view of the entire market, the VIX index is the industry's go-to fear gauge.
When you're looking at a single stock, you'll want to use Implied Volatility (IV) Rank and IV Percentile. Think of IV Rank as a speedometer for a stock's current IV, comparing it to its highs and lows over the past year.
As a general rule of thumb, an IV Rank above 50 is considered high. That might be a good time to look at strategies that involve selling options. If the rank is low, it suggests volatility is cheap, which could favor strategies where you buy options instead.
Ready to stop guessing and start making data-driven options trades? Strike Price provides real-time probability metrics for every strike price, helping you balance risk and reward with confidence. Find your next high-probability trade with a free trial at Strike Price.