What Are Option Greeks A Trader's Guide
If a stock moves past your strike, the option can be assigned — meaning you'll have to sell (in a call) or buy (in a put). Knowing the assignment probability ahead of time is key to managing risk.
Posted by
Related reading
A Step-by-Step Covered Calls Example for Consistent Income
Unlock consistent income with our step-by-step covered calls example. This guide breaks down the strategy, risks, and outcomes to help you trade confidently.
Long Call and Short Put The Ultimate Synthetic Stock Guide
Unlock the power of the long call and short put strategy. This guide explains how synthetic long stock works, its benefits, risks, and how to execute it.
What is a Call Spread? A Clear Guide to Bull and Bear Spreads
What is a call spread? Discover how bull and bear spreads limit risk and sharpen your options trading strategy.
If you've ever felt like you're missing a key piece of the puzzle in options trading, you're not alone. That missing piece is often a firm grasp of the Option Greeks.
The Greeks are a set of metrics that tell you exactly how an option's price is likely to react to changes in the market. Think of them as the dashboard for your trading position, showing you its sensitivity to stock price changes (Delta), the steady march of time (Theta), and shifts in market jitters, or volatility (Vega).
Trading without them is like flying a plane with no instruments—you’re essentially guessing your way through turbulence. This guide will demystify each Greek with practical analogies and real-world examples to get you flying with confidence.
Decoding the Language of Options
These metrics aren't just abstract concepts from a textbook; they are the tools of the trade. Born out of mathematical models like Black-Scholes in the early 1970s, the Greeks give traders precise measurements of both risk and potential reward.
To help you get started, this infographic shows the core sensitivities every options trader needs to know.
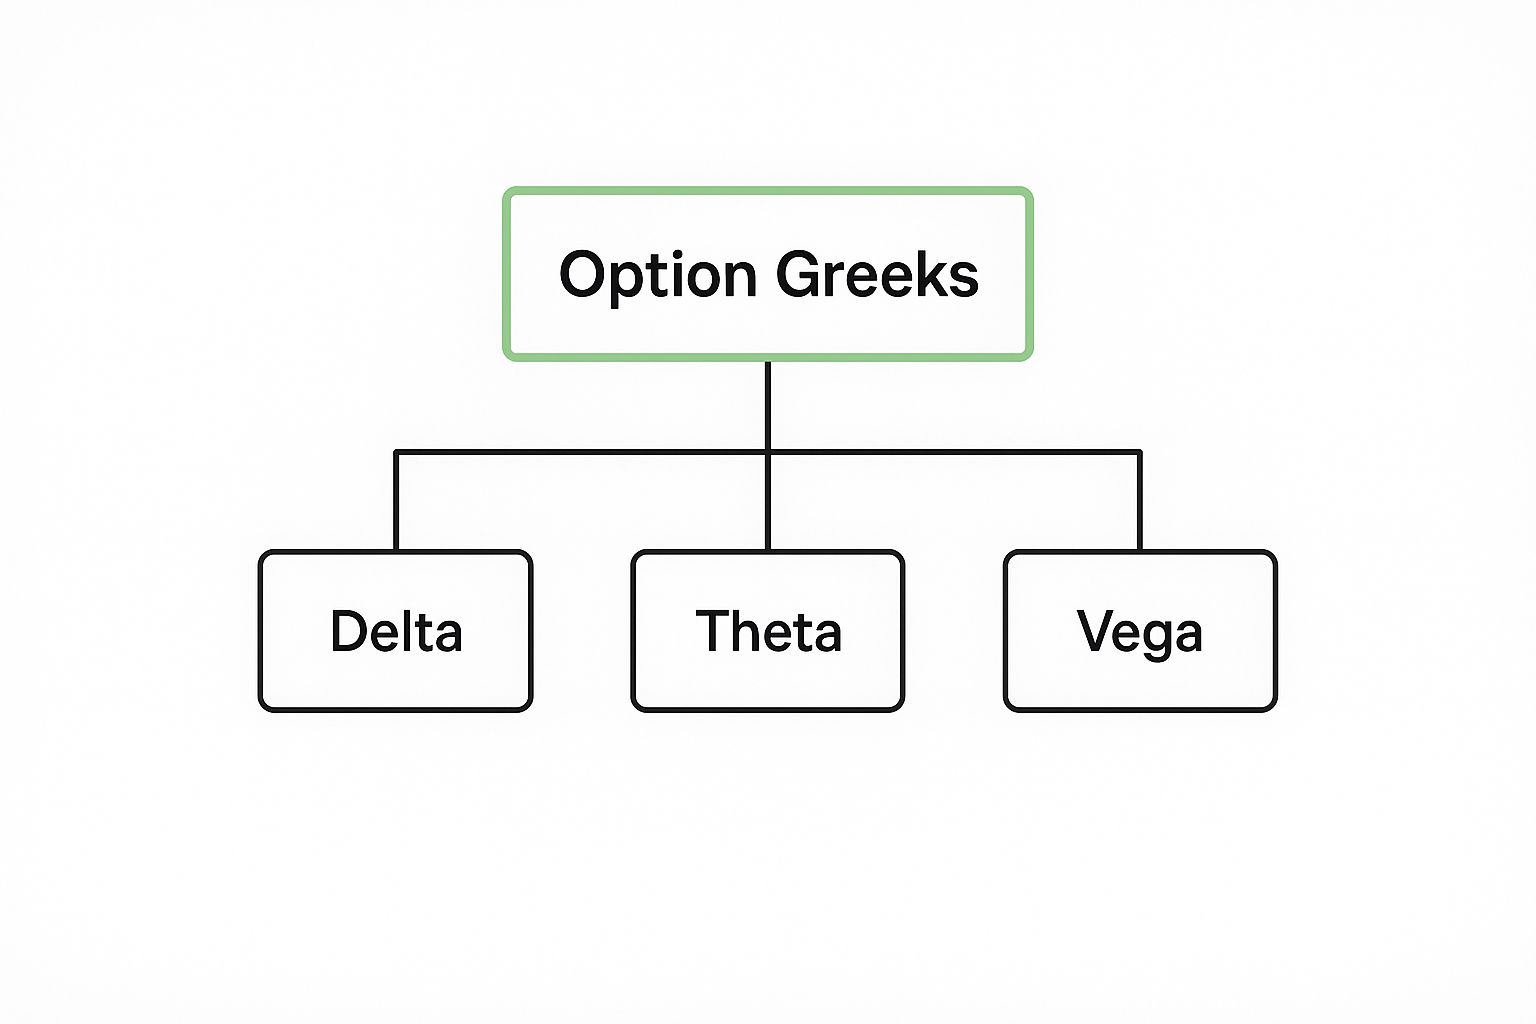
As you can see, each Greek measures a different risk factor, from price movement to time decay. We're about to explore each one in detail.
What We're Covering
Before we dive deep, let's map out our journey. We'll be zeroing in on the Greeks most critical for sellers of covered calls and cash-secured puts.
The goal isn't to turn you into a mathematician. It's to build an intuitive feel for how your positions will behave as the market moves. Understanding the Greeks turns guesswork into a repeatable, data-driven process.
To give you a quick cheat sheet before we get into the weeds, here’s a simple breakdown of the main Greeks we'll be discussing.
Quick Guide to the Five Main Option Greeks
| Greek | What It Measures | Simple Analogy |
|---|---|---|
| Delta | Change in option price per $1 move in the stock | The option's "speedometer" |
| Gamma | Rate of change in Delta | The option's "accelerator" |
| Theta | Price decay as time passes | The option's "melting ice cube" |
| Vega | Change in price due to volatility shifts | The option's "fear gauge" |
| Rho | Change in price due to interest rate shifts | The option's "interest rate sensitivity" |
This table gives you a bird's-eye view. Now, we're ready to unpack what each of these really means for your trades.
Here’s a quick overview of what's next:
- The Big Four: A detailed breakdown of Delta, Gamma, Theta, and Vega.
- Real-World Use: How to apply this knowledge to your selling strategy.
- Smarter Risk Management: Using the Greeks to protect your portfolio.
For those eager to jump ahead, our guide that helps explain the greeks for options in more detail is a great place to start. This article will build on those fundamentals, giving you a complete roadmap to mastering these essential trading tools.
Delta: Understanding Directional Risk
If you’re going to master one Option Greek, make it Delta. Think of it as your position’s speedometer—it tells you exactly how much an option's price should move for every $1 change in the underlying stock.
A Delta of 0.40, for example, means that option’s premium will gain or lose about $0.40 for each dollar the stock goes up or down. For options sellers, this instantly puts a number on the directional risk you're taking on.

It’s a clean, straightforward way to see how sensitive your position is to the stock’s movement. A high Delta means your option is highly reactive to price swings, while a low Delta means it’s much less affected.
How Delta's Sign Tells a Story
Delta values always live within a specific range, and whether they're positive or negative tells you everything you need to know about how the option behaves.
- Call Options: Always have a positive Delta, from 0 to +1.0. Their value goes up as the stock price rises.
- Put Options: Always have a negative Delta, from -1.0 to 0. Their value goes up as the stock price falls.
So, a call option with a +0.30 Delta will gain roughly $30 (0.30 x 100 shares) if the stock climbs $1. But here's a key insight for sellers: when you sell a cash-secured put with a -0.20 Delta, your position actually has a positive Delta of +0.20. Selling a put is a bullish move, and Delta confirms it.
Delta's Second Job: The Probability of Success
Beyond measuring price sensitivity, Delta has another equally important job. It acts as a rough, real-time estimate of an option’s probability of expiring in-the-money (ITM). This dual role is incredibly valuable, especially when you're selling covered calls and cash-secured puts.
If you sell a call with a 0.25 Delta, you can infer there's about a 25% chance the stock will close above your strike at expiration. That also means there's a 75% chance it expires worthless, letting you walk away with the full premium.
For an option seller, Delta isn't just a risk metric—it's a tool for strategic decision-making. It transforms the abstract concept of 'probability' into a concrete number you can use to select strike prices that align with your risk tolerance and income goals.
This is how sellers can systematically pick positions that offer the right balance of safety and reward for their strategy.
Using Delta to Select Strike Prices
For income-focused traders, picking the right strike price is everything. Delta gives you a data-driven way to make that choice, turning what feels like guesswork into a calculated move. A common approach for more conservative sellers is to pick options with a low Delta.
Example: Selling a Covered Call
Let’s say you own 100 shares of XYZ, currently trading at $150. You want to sell a covered call for income but would prefer to keep your shares. Here's how Delta helps you decide:
- Low-Risk Option (High Probability of Success): You could sell a call with a $165 strike price and a Delta of 0.15. This implies there's only a ~15% chance the stock rallies past $165 by expiration. Your probability of keeping both the shares and the premium is around 85%.
- Higher-Risk Option (Higher Premium): Or, you could sell a call with a $155 strike and a Delta of 0.40. This will pay a higher premium, but it comes with a ~40% chance of your shares being called away.
At-the-money options always have a Delta near 0.50 (or -0.50 for puts), signaling a 50/50 coin flip of expiring ITM. As an option moves further out-of-the-money, its Delta shrinks toward zero. Conversely, as it goes deeper in-the-money, its Delta approaches 1.0 (or -1.0), making it behave almost exactly like the stock itself.
Platforms like Strike Price are built on this exact principle. They use real-time Delta to calculate the probability of profit for every strike price available. This empowers you to instantly see which options meet your personal safety threshold, making it far easier to execute a consistent, probability-based income strategy. Once you get a feel for Delta, you can finally stop guessing and start trading with calculated confidence.
Gamma: The Accelerator Pedal
If Delta is your option's speedometer, then Gamma is the accelerator pedal. It tells you how fast your Delta will change for every $1 move in the underlying stock. Think of it this way: Delta shows your current directional risk, but Gamma reveals how stable that risk actually is.
A low Gamma means your Delta is pretty steady. Small bumps in the stock price won't change your exposure much. But a high Gamma? That means your Delta is jumpy and can shift dramatically, turning what felt like a safe position into a wild ride, fast. This is the Greek that often catches traders by surprise.
Why Gamma Matters to Option Sellers
For anyone selling options, Gamma is a critical risk factor, especially as you get closer to expiration. When you sell an option, you are "short Gamma," which is a fancy way of saying that as the stock moves against you, your directional risk (Delta) picks up speed.
- Selling a Cash-Secured Put: If the stock price drops, your position's positive Delta will shrink faster and faster, making your position less bullish.
- Selling a Covered Call: If the stock price rallies, your position's negative Delta will get more negative at an accelerating rate, increasing your bearish exposure.
This acceleration is precisely why a stock hovering near your strike price can feel so unpredictable in its final days. Your whole risk profile can flip on a dime.
Gamma is always highest for options that are right at-the-money (ATM) and nearing their expiration date. This "Gamma risk" is the reason a position that was comfortably out-of-the-money all month can suddenly turn into a high-stakes gamble in the final week.
Understanding this lets you see trouble coming. You can manage your positions proactively instead of just reacting when things get chaotic.
Visualizing Gamma in Action
Let’s say you sold a cash-secured put on stock XYZ with a $100 strike price. The stock is currently trading at $105, and your option has a Delta of 0.20 and a Gamma of 0.05.
Right now, your directional exposure is equivalent to owning 20 shares of XYZ. Now, let's watch what happens when the stock price starts to fall.
Scenario One: Stock Drops to $104
- Stock Move: -$1.00
- New Delta Calculation: Original Delta (0.20) + Gamma (0.05) = 0.25
- Result: Your directional exposure has now ramped up to that of owning 25 shares. The position is getting more bullish as the stock drops toward your strike.
Scenario Two: Stock Continues to Drop to $103
- Stock Move: Another -$1.00
- New Delta Calculation: Previous Delta (0.25) + Gamma (0.05) = 0.30
- Result: The acceleration continues. Your exposure is now the same as holding 30 shares.
As you can see, Gamma makes your Delta snowball as the stock gets closer to your strike. This is why a trade can feel totally stable one day and incredibly risky the next, especially in that last week before expiration when Gamma values can spike.
Managing Gamma Risk as a Seller
Ignoring Gamma is a classic rookie mistake. A position might look safe with a low Delta, but high Gamma can easily lead to an unexpected assignment if the stock makes a sudden lurch toward your strike.
Here’s how you can stay ahead of it:
- Watch At-the-Money Positions: Pay close attention to your options as they get near the at-the-money point, especially in the last two weeks before expiration. This is Gamma's playground.
- Don't Hold Through Earnings: Earnings announcements are famous for causing huge, unpredictable price gaps. That kind of volatility can pour fuel on the Gamma fire.
- Close Out Early: One of the easiest ways to sidestep peak Gamma risk is to simply close your short options before the final week. Many traders are happy to capture 50-75% of the premium and get out, neutralizing the risk of a last-minute headache.
By understanding what Gamma is really measuring—the rate of change of your risk—you can better predict how your positions will behave and protect your portfolio from those sudden, unwelcome surprises.
Theta: Profiting From Time Decay
Of all the Option Greeks, Theta is probably the most intuitive. Why? Because it represents something we all understand perfectly: time.
Think of an option's premium as a melting ice cube. Every single day, a small piece of its value disappears forever. Theta is simply the Greek that measures how fast that ice cube is melting.
For option buyers, Theta is a constant headwind they can't avoid. They need the stock to move in their favor—and fast—to outrun the daily melt. But for us, the option sellers, Theta is our best friend. It’s the primary engine that drives our profits. It's the reason we can collect a premium and potentially keep all of it, even if the underlying stock doesn’t move a single penny.

This daily erosion of value is why time is the greatest asset for an option seller. We are essentially selling a depreciating asset, and every tick of the clock works in our favor.
Understanding Theta in Dollar Terms
Theta is usually shown as a negative number, which tells you how much money an option is expected to lose per day. This assumes, of course, that other factors like the stock price and volatility stay the same.
So, if an option has a Theta of -0.05, it means it’s set to lose about $5 in value each day (0.05 x 100 shares per contract) from time decay alone.
But here’s the critical part: this decay isn't a straight line. It starts off slow and then accelerates like a rocket as the expiration date gets closer. An option with 90 days left is barely melting, while one with only 10 days left is losing value at a much faster clip.
For an option seller, Theta is your daily paycheck. It's the predictable, consistent force that generates income from your positions. By selling options, you switch from fighting against time to having time work directly for you.
This acceleration is most powerful in the final 30-45 days of an option's life. That's exactly why so many income-focused traders concentrate their efforts in this window—they want to capture the steepest part of the time decay curve and maximize that daily "paycheck."
The Sweet Spot for Selling Options
Why is that 30-45 day window so popular? It’s the sweet spot. It strikes a strategic balance between collecting a decent premium and benefiting from accelerated time decay, all without taking on the extreme risk that comes with the final week of expiration.
Here’s how the decay curve usually plays out:
- 90-60 Days Out: Time decay is slow and gradual. The option is losing value, but not very quickly.
- 45-30 Days Out: The rate of decay really starts to pick up. This is where sellers find a great mix of solid premium and faster Theta decay.
- Final 14 Days: Theta decay goes into overdrive. While the daily profit potential is highest here, so is the Gamma risk, making your positions incredibly sensitive to even small price moves.
By targeting that 30-45 day range, you position yourself to capture significant premium decay while still giving yourself enough time to manage the trade if the stock moves against you. For a deeper dive, our article on how to profit from options time decay provides even more detail on this strategy.
How Theta Impacts Your Strategy
The effect of time decay becomes especially powerful as expiration looms. To give you an idea, standard at-the-money options can lose 2-5% of their value daily during the final week, purely from time decay. This highlights the massive risk for buyers and the incredible opportunity for sellers.
Understanding Theta helps you become a more patient, strategic trader. If you've sold a cash-secured put and the stock is just hovering above your strike, Theta is doing the work for you. Every day that passes without a big downward move, your position gets more profitable as the option's value just melts away.
At its core, selling options is about selling time. When you sell a covered call or a cash-secured put, you’re letting the clock do the heavy lifting, turning the relentless march of time into a consistent source of income for your portfolio.
Vega and Rho: Navigating Market Fear and Interest Rates
So far, we've covered the Greeks tied directly to the stock price and time. But two other powerful, external forces are always lurking in the background: market fear and the cost of money. We have a Greek for each: Vega and Rho.
While they might feel less immediate than Delta or Theta, ignoring them can leave your portfolio open to nasty surprises.
First up is Vega. It measures how much an option’s price changes for every 1% shift in implied volatility. Think of implied volatility as the market's "fear gauge." When uncertainty spikes—think earnings reports or big Federal Reserve meetings—so does volatility, pumping up option premiums across the board.
As an option seller, you are "short Vega." This just means rising volatility is your enemy because it inflates the value of the options you sold. On the flip side, falling volatility is your best friend, causing the premium to decay even if the stock price doesn't budge.
Putting Vega's Impact in Dollars
Let's make this real. If an option has a Vega of 0.10, its price will jump up or down by $10 (that's 0.10 x 100 shares) for every single 1% change in implied volatility.
This effect is way more dramatic for longer-dated options. A contract expiring in six months will have a much higher Vega than one expiring next week simply because there’s more time for uncertainty and fear to creep in.
Here’s why this is so critical for sellers:
- Sell When Fear is High: The absolute best time to sell options is often when the fear gauge is cranked up. That's when you can collect the fattest premium right from the start.
- Ride the "Volatility Crush": After a big event like an earnings announcement is over, implied volatility often plummets. This "crush" makes option prices drop like a rock, handing a quick profit to sellers who saw it coming.
Vega gets to the heart of what you're doing as an option seller. You aren't just selling a bet on a stock's direction; you're also selling a piece of market uncertainty. When that fear dies down, the value of what you sold drops, and you pocket the difference.
Understanding Vega helps you time your trades better and avoid getting burned by a sudden volatility spike. All these metrics, including Vega, are laid out clearly when you learn how to read an option chain on any modern trading platform.
Rho: The Forgotten Greek That's Making a Comeback
And finally, we have Rho. This Greek measures an option's sensitivity to changes in interest rates. For years, when interest rates were hovering near zero, pretty much everyone ignored Rho. It's usually the least important Greek for short-term options, but it's suddenly relevant again in a world of changing rates.
Rho tells you how much an option's price will change for every 1% increase in the risk-free interest rate.
- Call options have a positive Rho, meaning their value inches up with interest rates.
- Put options have a negative Rho, meaning their value inches down.
The logic here is that higher interest rates make holding stock more expensive (because of the cost of capital), which makes the cheaper alternative—a call option—a tiny bit more appealing. The effect is almost invisible for options expiring in a month, but it becomes more noticeable for long-term options (LEAPS) that expire a year or more out.
For the average seller of covered calls and cash-secured puts with 30-60 days until expiration, Rho will almost never be the main reason a trade works or fails. Still, knowing it exists gives you the complete picture of all the forces that can pull and push on your positions.
Analyzing an Options Trade in the Real World
Understanding the Greeks in theory is one thing, but seeing them work together is where it all clicks. Let's shift from concepts to a real-world scenario by breaking down a common strategy: selling a covered call. This example will show you how the Greeks reveal a trade's true risk and reward profile before you even place the order.
Imagine you own 100 shares of a company, XYZ, currently trading at $100 per share. You decide to sell a covered call against it with a $105 strike price that expires in 30 days. For selling this contract, you collect a $1.50 premium, which is $150 in your pocket.
The Initial Position Snapshot
The second you place that trade, your brokerage platform gives you a snapshot of the Greeks for the short call you just sold. It's important to remember that since you sold the option, the signs of the Greeks are flipped for your position.
- Delta: -0.30 (When combined with your 100 shares, your total position Delta is actually +0.70)
- Gamma: -0.04
- Theta: +0.03
- Vega: -0.08
So, what does this actually tell you? Right off the bat, you know your position should earn about $3 every day just from time decay (Theta). You also see that if volatility drops by 1%, you’ll make another $8 (Vega). That negative Gamma is your warning sign: if the stock price rallies toward your $105 strike, your directional risk will start to pick up speed.
This dashboard of numbers isn’t just static data; it’s a dynamic forecast. It tells a story about how your trade will likely behave under different market conditions, letting you anticipate changes instead of just reacting to them.
Simulating What Happens Next
Now for the fun part. Let's see how the Greeks predict your position's behavior as the market moves around. We’ll run through a few hypothetical scenarios to see how your profit and loss (P/L) might change.
The table below breaks down what happens if the stock price moves, time passes, or volatility shifts. This is the real power of the Greeks: they give you a roadmap for potential outcomes.
Analyzing an Example Covered Call Trade (XYZ at $100)
Here’s a look at our initial trade and a few ways the market could move, changing our option's value.
| Scenario | Stock Price | Days Passed | IV Change | Estimated Option Price Change | Key Greek Influencing Change |
|---|---|---|---|---|---|
| Stock Rises $1 | $101 | 0 | 0% | +$0.30 | Delta |
| 5 Days Pass | $100 | 5 | 0% | -$0.15 | Theta |
| Volatility Drops 2% | $100 | 0 | -2% | -$0.16 | Vega |
| Stock Jumps $5 | $105 | 0 | +3% | +$1.26* | Delta, Gamma, & Vega |
Note: The $5 jump is a combination of Delta's initial move, Gamma accelerating that Delta, and Vega increasing the option's price due to the volatility spike from the large move.
This step-by-step simulation moves the Greeks from abstract numbers into tangible tools. By looking at these figures before you even enter a trade, you can get a much clearer picture of whether the potential reward is worth the risks defined by Delta, Gamma, and Vega. It's about trading smarter, not harder.
Got Questions About the Greeks?
As you start putting the Greeks to work, a few practical questions always pop up. Getting these answers straight is how you build confidence and turn theory into actual, profitable trades. Here are some of the most common ones I hear from traders.
Which Greek Is the Most Important?
For anyone selling covered calls and cash-secured puts, your go-to metrics day in and day out will be Delta and Theta. It's that simple. Delta gives you a quick read on your directional exposure and odds of success, while Theta is the engine of time decay that drives your income.
That said, Gamma and Vega suddenly become critical around events like earnings reports or during wild market swings. That’s when risk can spiral out of control if you’re not paying attention.
Do I Need Special Software to See the Greeks?
Nope. Pretty much every modern brokerage platform bakes the Option Greeks right into their standard options chain.
You can usually customize the columns on your trading screen to show Delta, Gamma, Theta, and Vega for any contract you're looking at. The data is right there, no special tools required.
This means you have all the key risk metrics you need to analyze a potential trade at your fingertips.
How Do the Greeks Change as an Option Gets Closer to Expiration?
This is where things get interesting. As an option gets closer to its expiration date, its personality changes—it becomes far more dynamic.
- Gamma and Theta both spike, especially for at-the-money options. Sensitivity to the stock's price (Gamma) and the rate of time decay (Theta) accelerate, making those final weeks both the riskiest and potentially most profitable.
- Delta gets pushed to the extremes. For in-the-money options, Delta races toward 1.0 (or -1.0 for puts), while it drops toward 0 for out-of-the-money options as they run out of time to become profitable.
Stop guessing and start making data-driven decisions. Strike Price calculates the real probability of profit for every option, giving you the clarity needed to sell contracts confidently. Find your next winning trade today.