How to Calculate Option Premium A Practical Guide
If a stock moves past your strike, the option can be assigned — meaning you'll have to sell (in a call) or buy (in a put). Knowing the assignment probability ahead of time is key to managing risk.
Posted by
Related reading
A Step-by-Step Covered Calls Example for Consistent Income
Unlock consistent income with our step-by-step covered calls example. This guide breaks down the strategy, risks, and outcomes to help you trade confidently.
Long Call and Short Put The Ultimate Synthetic Stock Guide
Unlock the power of the long call and short put strategy. This guide explains how synthetic long stock works, its benefits, risks, and how to execute it.
What is a Call Spread? A Clear Guide to Bull and Bear Spreads
What is a call spread? Discover how bull and bear spreads limit risk and sharpen your options trading strategy.
Figuring out an option's price boils down to two key ingredients: its intrinsic value (the money it's worth right now if exercised) and its extrinsic value (the price of its future potential, driven by time and volatility). For a more precise calculation, traders often turn to models like Black-Scholes, which crunch numbers like the stock price, strike price, time left, volatility, and interest rates.
What Is an Option Premium and Why Does It Matter?
Simply put, an option premium is the market price you pay to buy—or get paid to sell—an options contract. It's the cost of locking in the right, but not the obligation, to trade a stock at a set price by a certain date.
But this price is more than just a number on your screen. It's a direct signal of what the market thinks about a stock's future. The premium is a mix of its real, immediate value and what traders are willing to pay for what might happen next.
The Two Pillars of an Option's Price
To really get a handle on an option's premium, you need to understand the two parts that make it up. Once you see how they work together, calculating and evaluating premiums becomes much more intuitive.
An option's premium is a combination of two distinct values. Let's break them down in this table.
| Component | Definition | Primary Driver |
|---|---|---|
| Intrinsic Value | The amount an option is "in-the-money." It's the immediate, tangible profit if exercised. | The difference between the stock price and the strike price. |
| Extrinsic Value | The "time value" or the market's price for the potential of the option to become profitable. | Time until expiration and implied volatility (expected price swings). |
Grasping these two components is the first real step toward understanding how any option is priced.
Let's look at a quick example. Say a stock is trading at $52. A call option with a $50 strike price has an intrinsic value of $2 per share ($52 - $50). If the total premium for this option is $3.50, then its extrinsic value is the remaining $1.50. Easy, right?
This extrinsic value is essentially the price of potential. It reflects the market's collective bet on factors like time until expiration and expected price swings (implied volatility).
The more time an option has until it expires and the more volatile the underlying stock is, the higher its extrinsic value will be. It makes sense—more time and bigger swings mean more chances for the stock to move in your favor. As the expiration date gets closer, this extrinsic value starts to disappear, a process every options trader knows as "theta decay."
The Core Ingredients of an Option Price

To really get a handle on option premiums, you have to know what goes into them. Think of it like a recipe. Each component plays a specific role, and if you change the amount of just one ingredient, you'll get a completely different result.
An option's price isn't just a random number. There are five main inputs that pricing models chew on to spit out a theoretical value. Understanding how each one nudges the premium up or down is what separates traders who are just guessing from those who have a real, intuitive feel for the market.
The Five Key Pricing Factors
Every option pricing model, from the most basic to the ridiculously complex, is built on these five pillars.
Underlying Stock Price: This is the most obvious one. When a stock's price goes up, call premiums get more expensive and put premiums get cheaper. The opposite happens when the stock price drops. Simple.
Strike Price: This is the locked-in price where you can buy (for a call) or sell (for a put) the stock. How the strike price relates to the current stock price is what gives an option its intrinsic value. Picking the right strike is a whole different ball game, which is why we have a complete guide on how to choose an option strike price.
Time Until Expiration (Time Value): More time equals more chances for the stock to make a big move in your favor. It's why an option with six months left on the clock will almost always cost more than one that expires next week, assuming everything else is the same.
Implied Volatility (IV): This is the market’s best guess on how much a stock will jump around. High IV means the market expects bigger price swings, which pumps up the premium for both calls and puts. Why? Because a bigger swing means a bigger potential payday.
Risk-Free Interest Rate: This one’s more of a minor player, but it still matters. Higher interest rates tend to give a slight boost to call premiums and a slight haircut to put premiums.
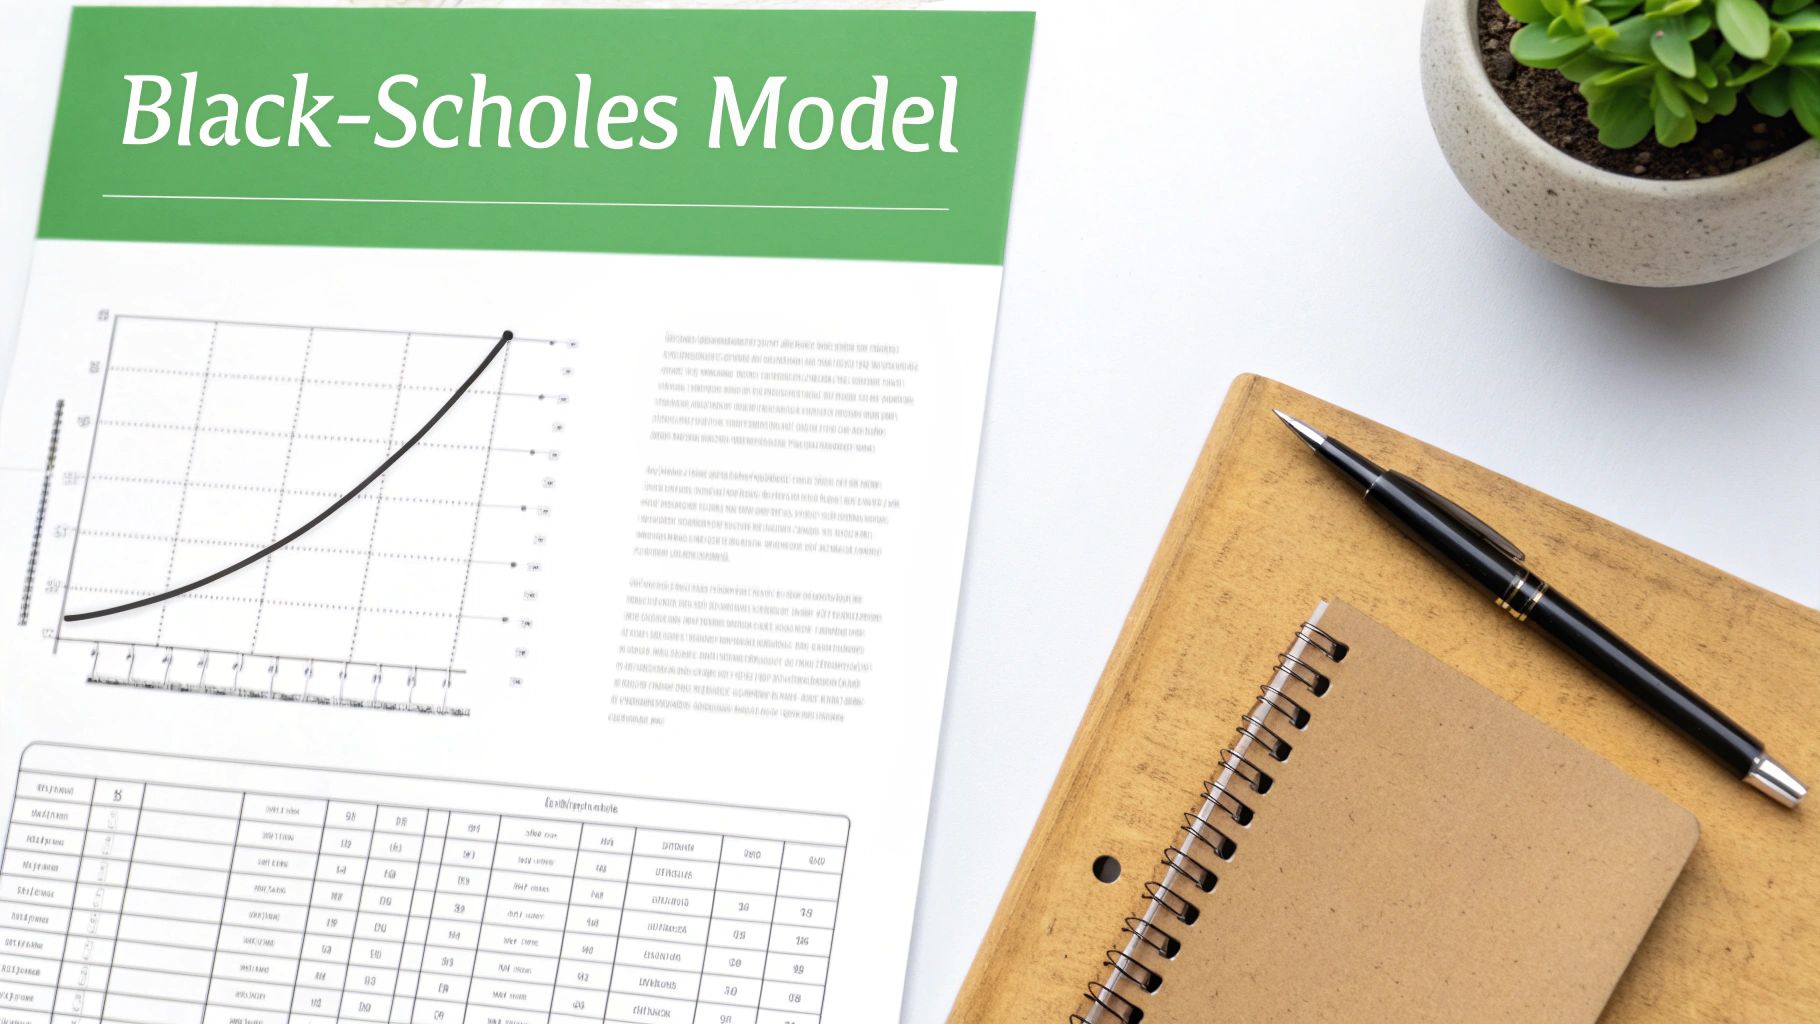
The most famous method for mashing all these inputs together is the Black-Scholes formula, which shook up the trading world back in 1973. It calculates a theoretical "fair price" for an option, giving traders a solid benchmark to work from.
Using the Black-Scholes Model in Practice
While knowing the individual ingredients is essential, the Black-Scholes model is the classic recipe that brings them all together. It's not a complex math exam you need to pass—think of it more like a powerful calculator for estimating an option's fair value. Honestly, you don't need to solve the formula by hand. Countless online calculators and trading platforms do the heavy lifting for you.
Your job is to understand what to plug in and, more importantly, how to interpret the results.
Plugging In the Variables
Let's walk through a real-world scenario. Imagine you're eyeing a call option on a big tech stock, we'll call it "TechCorp" (TCKR), which is currently trading at $150 per share.
You're interested in a call option with these specifics:
- Strike Price: $155
- Time to Expiration: 30 days (which the model translates to about 0.082 years)
- Implied Volatility (IV): 25% (this is the market's best guess of future price swings)
- Risk-Free Interest Rate: 5% (we can pull this from current Treasury bill rates)
When you plug these five inputs—stock price, strike price, time, volatility, and interest rate—into a Black-Scholes calculator, it spits out a theoretical premium. This gives you a crucial benchmark to compare against what the option is actually selling for in the market.
Introducing the Greeks
The real magic of the Black-Scholes model isn't just that final price. It's the practical outputs known as the "Greeks." These metrics are invaluable because they show you exactly how sensitive your option's premium is to different market forces.
The Greeks are your dashboard indicators. They tell you how your option’s price will likely change when the market moves, time passes, or volatility shifts. Understanding them turns you from a passenger into a pilot.
Here are the ones that matter most:
- Delta: This shows how much the option's premium should change for every $1 move in the stock price. A Delta of 0.40 means the premium will likely increase by about $0.40 if the stock pops $1.
- Theta: This is the measure of time decay. A Theta of -0.05 means your option is expected to lose about $0.05 in value each day, assuming nothing else changes. It's a constant headwind.
- Vega: This reveals the option's sensitivity to changes in implied volatility. If Vega is 0.10, the premium should rise by $0.10 for every 1% jump in IV.
This infographic breaks down the relationship between intrinsic value, time value, and the final option premium you pay.
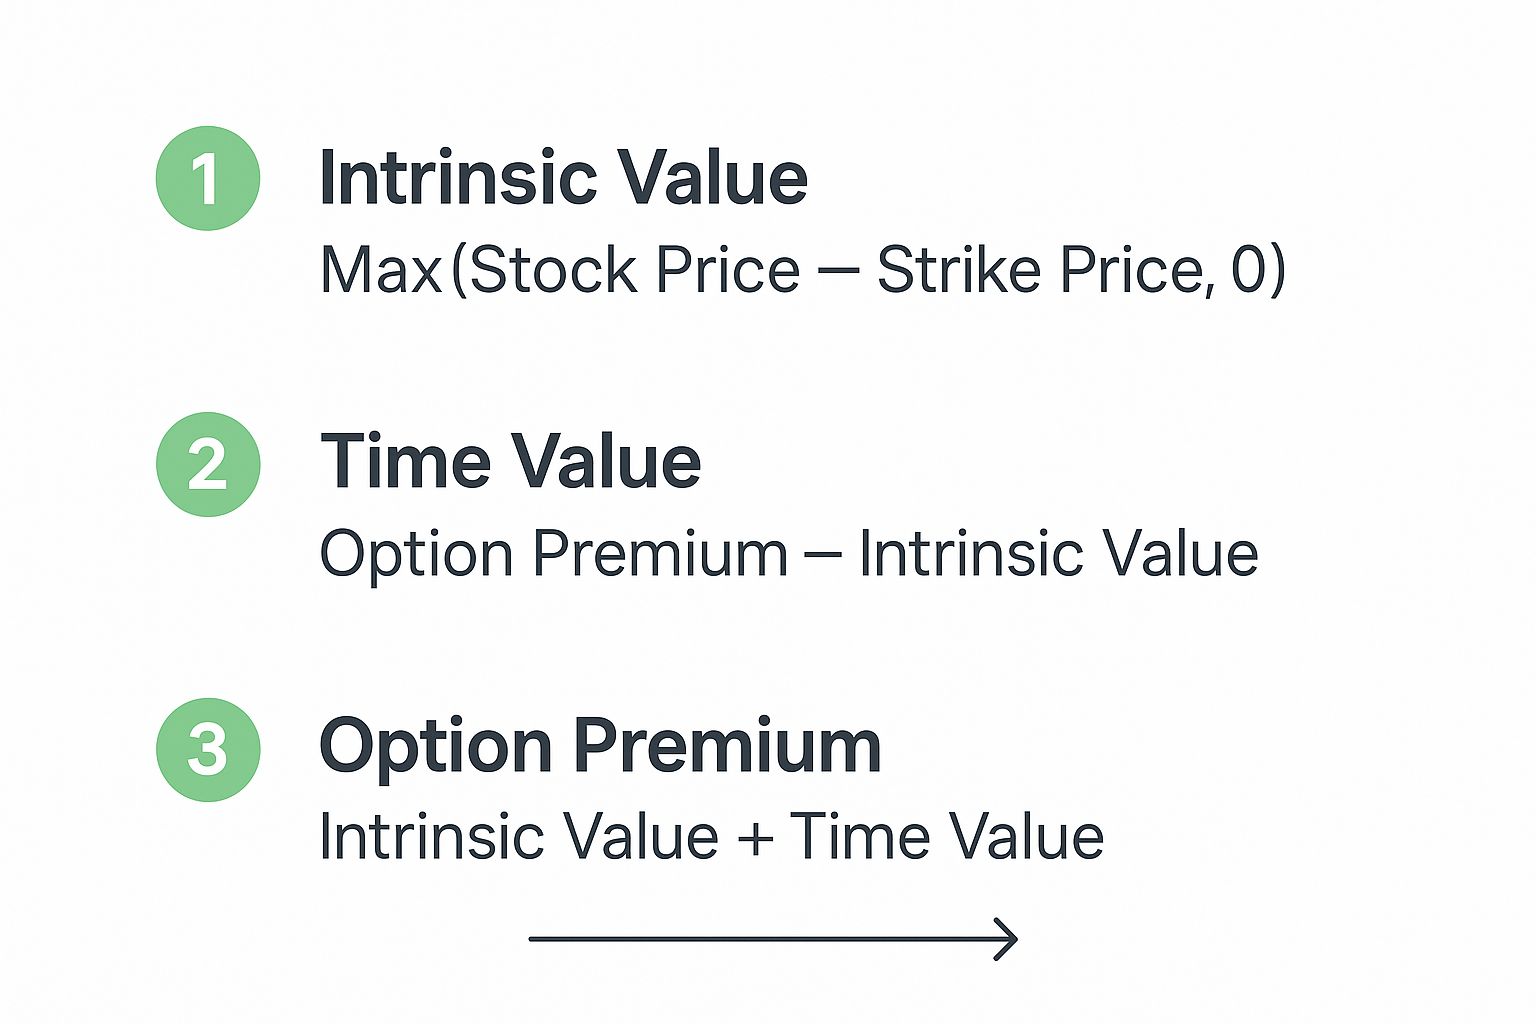
It’s a simple but powerful visual. An option's total cost is always the sum of its immediate, tangible worth (intrinsic value) and its potential future worth (time value).
How Volatility Shapes an Option's Value
 Of all the factors that bake into an option's price, volatility is the one that seasoned traders obsess over. It's the secret sauce that can make premiums balloon or completely collapse, sometimes even when the stock itself is barely moving. If you’re learning how to calculate an option's premium, you absolutely have to get a handle on this.
Think of volatility as the market's heartbeat. When the pulse is racing, it signals excitement or fear, which naturally leads to bigger price swings. It’s this uncertainty that pumps up an option’s extrinsic value—after all, bigger swings create more chances for an option to finish in-the-money.
Historical vs. Implied Volatility
It’s really important to know the difference between the two main types of volatility. They tell very different stories.
- Historical Volatility (HV): This is rear-view mirror stuff. It measures how much a stock’s price has actually moved in the past. It’s a track record.
- Implied Volatility (IV): This is the market looking forward. It’s a real-time forecast of how much the stock is expected to swing in the future.
While HV gives you some great context, it's the implied volatility that gets plugged directly into an option's premium. Ever notice how premiums get expensive right before an earnings report? That’s the market pricing in a high IV, bracing for a potentially big move in the stock.
This gets taken to the extreme during major market events. For example, during the financial crisis in 2008, implied volatility on major indexes like the S&P 500 shot up from around 20% to over 80%. As a result, option premiums jumped by as much as four or five times their normal cost, reflecting the massive fear and uncertainty in the air.
At its core, trading options isn't just about betting on a stock's direction. It's also a way to trade the market's collective guess about future chaos. High IV means higher premiums for calls and puts alike.
Figuring out how to handle these volatility spikes is a make-or-break skill for any options trader. You can dive deeper into this with our guide on options risk management. Getting a feel for IV helps you avoid overpaying for options and, just as importantly, spot those moments when selling premium might be an especially good idea.
From Theory to the Trading Floor
A pricing model like Black-Scholes is an incredible tool. It gives you a clean, theoretical value for an option, but the price you actually see on your trading platform? That’s almost always a little different.
This is where the neat world of financial models bumps up against the messy reality of a live market. The final price you pay, or the premium you pocket, is ultimately hammered out by old-fashioned supply and demand.
The first thing you’ll notice is the bid-ask spread. Think of it like this: the “bid” is the highest price a buyer is willing to pay right now, while the “ask” is the lowest price a seller is willing to accept. The premium you see quoted is often just the midpoint. To open a position immediately, you have to buy at the ask (the higher price) or sell at the bid (the lower price). That tiny gap is the market maker's profit.
The Impact of Liquidity
So, what determines the size of that bid-ask spread? It all comes down to liquidity, which you can gauge with two key metrics:
- Trading Volume: This is the raw number of contracts changing hands in a day. High volume is a sign of strong interest, which naturally leads to tighter, more competitive spreads.
- Open Interest: This tells you the total number of outstanding contracts that haven't been closed out yet. High open interest suggests a deep, well-established market for that specific option.
For big, popular stocks, you'll see razor-thin spreads, sometimes just a penny wide. But for obscure, less-traded options, that spread can be a chasm, making it a lot more expensive to get in and out of a trade.
The theoretical price from a model is your map, but the live market is the terrain. Supply, demand, and liquidity determine the path you actually take.
Ultimately, these market forces are what set the final premium. In the real world, the price isn't just about the greeks; it's also about bid-ask spreads, open interest, and volume. For example, statistical analysis shows that net premium flows—the total premium bought minus what was sold—can act as a strong signal for market sentiment. You can discover more about option analytics on Fidelity.com to see how data from major exchanges reveals that options traded at the ask price often point to bullish positions, while those at the bid tend to reflect a more bearish outlook.
Common Questions on Option Premium Calculations
Once you start putting these models to work, a few questions almost always pop up. Let’s walk through some of the most common points of confusion I see, which should help everything click when you're calculating option premiums in the real world.
Why Is My Broker's Price Different from My Calculation?
This is probably the number one question I get. You run the numbers, get a theoretical premium, then look at your broker's platform and see something different. It’s frustrating, but it's completely normal.
The Black-Scholes model gives you a theoretical "fair" value, but your broker shows the actual market price—what people are paying right now based on live supply and demand.
Here’s why they usually don't match perfectly:
- The Bid-Ask Spread: The price you see is often the midpoint. The actual price to buy (the ask) is always a bit higher than the price to sell (the bid).
- Implied Volatility Mismatch: The IV you plug into a calculator might be a hair different from what the market is using at that exact second. Volatility inputs can change fast.
- Market News: A sudden news event or rumor can throw prices out of whack for a bit, and a model simply can't predict that kind of short-term chaos.
Think of the model's price as your North Star—it tells you what the option should be worth. The market price tells you what it's worth right now.
Can an Option Premium Ever Be Negative?
Nope. An option premium can never, ever be negative. The premium is the price you pay for a right, not an obligation. Since that right can't have less than zero value, the lowest its price can go is zero.
The absolute floor for an option's value is $0. This usually happens at expiration when an option is out-of-the-money and all its time value has completely evaporated.
How Do Dividends Affect Option Premiums?
Dividends have a direct and pretty predictable impact on option prices. When a company pays a dividend, its stock price is expected to drop by about the dividend amount on the ex-dividend date. The options market knows this is coming and prices it in.
This expected price drop makes call options less valuable, so their premiums are typically lower. On the flip side, it makes put options more valuable, pushing their premiums higher.
This is a huge deal if you sell options for income. Understanding how dividends affect your positions is critical, which you can see in our detailed cash-secured put example. All the sophisticated pricing models factor in scheduled dividends to get an accurate theoretical value.
Ready to turn theory into consistent income? The Strike Price platform gives you real-time probability data to help you sell covered calls and cash-secured puts with confidence. Stop guessing and start making data-driven decisions. Explore Strike Price today.